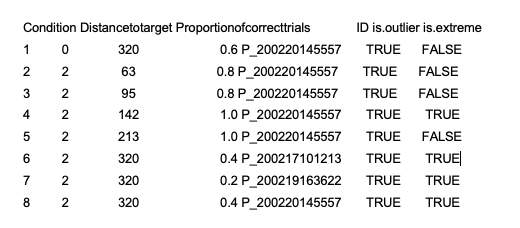
Am I right in removing all the datapoints above which correspond to OUTLIER = TRUE as a next step, in order to make the analysis as accurate/truthful as possible?
When I remove these outliers, both of my within subjects variables become significant, rather than only one prior to removal (two-way repeated measures ANOVA).
Additionally, when I check for outliers after I remove the outliers above, it gives me this output:
In every distribution some values are more towards the edge than the middle (that's what a distribution is...), It only makes sense to remove outlying values that you believe are spurious or not reflecting of the reality of what you are studying. I don't think you shared with us what it is you ar studying, so it's not possible to bring any domain expertise to bare on the question of what approach.
Yes, there's a never ending loop. You can always cut a string shorter , removing some from the end... Until it's all gone.
I hope to communicate that even though we love R here, it's only a tool to help us think and work. It's a mistake to follow a recipe for an R analysis without thinking about the data and what it represents in reality.
I am looking at Path integration in humans using solely self-motion cues derived from optic flow through a virtual reality headset. The dependent variable is the proportion of correct trials: the number of trials across the experiment in which a subject correctly stops in the target zone. The within-subjects factors are the distance: the distance of the trajectory to the target changes throughout the experiment and the gain: the maximal velocity at which the subject can travel one each trial changes. Thus, an 'outlier' in the table above would refer to a data point where a particular human subject may be particularly successful in navigating to the target zone despite being far off from the mean level of success. Nonetheless, humans show great inter-individual differences in PI ability too, and thus certain subjects may have be better at navigating due to more VR experience/differing underlying anatomical brain differences/FC and thus certain subjects may indeed be better at navigating?
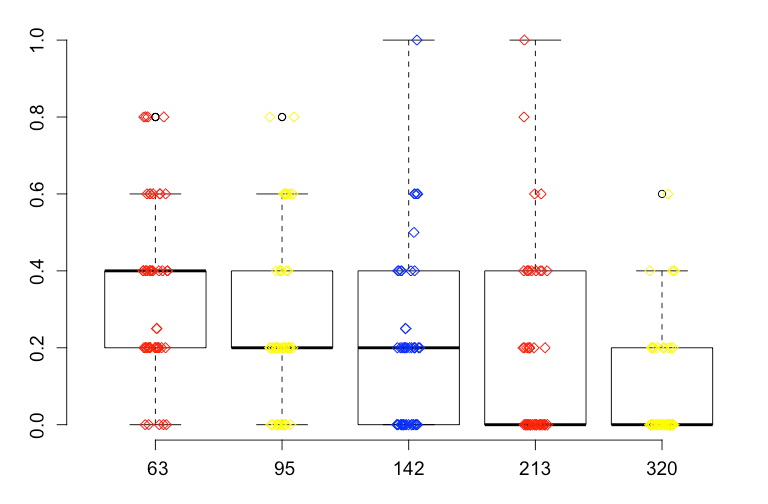
My gut instinct is that you'd want to remove outliers that are so extraordinary that if they seem too fast, it seems like a measurement error / some fault not involving the human, and ditto extreme slowness. Have you tried visualising the distribution and seeing its shape and the degree of regularity? The outlier identifying function you are using is based on a box plot approach (says it's documentation) have you visualised it ASA box plot or through other means to help decide what to do? I think you should be trying to keep as much experimental data you can and not throw it away lightly , and without some justification.
Yes, I mean something as simple as a scatter plot, or histogram (which may or may not reveal normality), in the case of discussing outliers you want to understand that visually I think. Again the outlier detection approach you are trying is based on boxplot , so boxplot is a reasonable way to try visualise also.
I'll add some context. In my field finance and credit risk. If I'm building models, one of the biggest challenges can be data quality. This means that every so often, someone has typed an absurd value into a field on a terminal corresponding to something. It's reasonable me to try and detect these and reject them as outliers because I doubt so strongly they reflect the truth of the account, customer, transaction or whatever. The model should be built on as much data as possible, or rather quality data. If a magical fairy could guarantee that all the data you received perfectly represents the reality of what you are analysing, would you have a motive to remove outliers per se? I mean, you might depending on what you are doing. But for most purposes you probably wouldn't ? Also if I told you the machine used to make your measurements can be expected to give a spurious result an order of magnitude out on every thousand samples, it's reasonable to think that that information would guide and justify an outlier detection and removal strategy.
But... If you are modelling the total system, subject under study and the machinery as a totality maybe you wouldn't even exclude them, because if you wanted to predict future performance , and there's no plan to improve the machines maybe the predictions should sometimes predict these odd tails. Am I making sense or just one long, out of my depth, ramble ? Anyone ?
An outlier is an observation that is numerically distant from the rest of the data. When reviewing a boxplot , an outlier is defined as a data point that is located outside the fences (“whiskers”) of the boxplot (e.g: outside 1.5 times the interquartile range above the upper quartile and bellow the lower quartile)
And so yes there are outliers upon visual inspection!
I would have to defer to your domain expertise. But nothing about the data seems all that suspicious to me as layman. The most I might consider is removing extreme rather than the more inclusive definition of outlier that you described. How many data points do you have all together ? 100? 200? I'd be reluctant to throw out more than 3 or 4 datapoints. But maybe that's just me.
And yes I agree, my gut instinct is not so apprehensive: my judgement is that I may only remove the extreme ones, but even so: the patterns seen are justifiable through biological explanation thanks so much for all your help!
I would vote to keep all your data.
Is this in an academic or commercial setting ? Perhaps you can take advice from a peer or senior in your organisation?
Anyway, if you are curious you could make a loop where you remove outliers and draw the boxplot around and a round a few times. And that should give you a feel for how aggressively it adjusts your data. And hopefully make you comfortable with the concept that there are always outliers the question is how much of they outly, and do we 'trust' them or not.