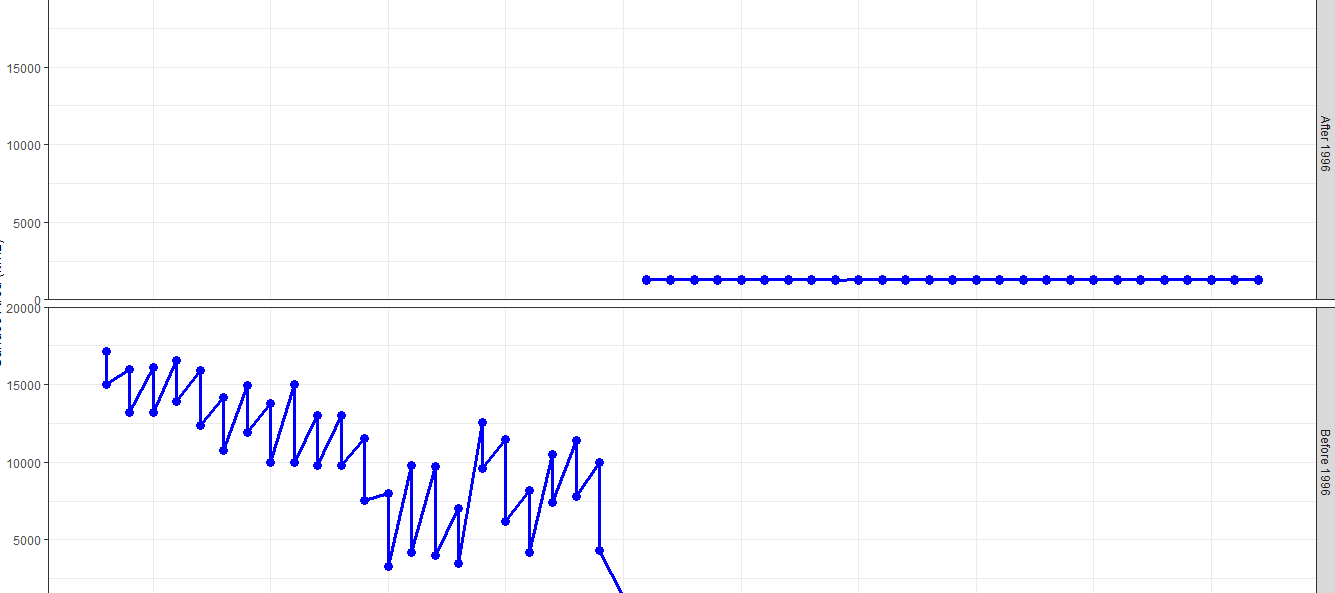
I have two data, before 1996, the trend was very high between 0-20000 but after 1996, all I had was very low between 0 -2000
Here is what I have gotten
Please show the code that makes the plot.
@FJCC , Thank you so much! I already figured this out.