我输入了
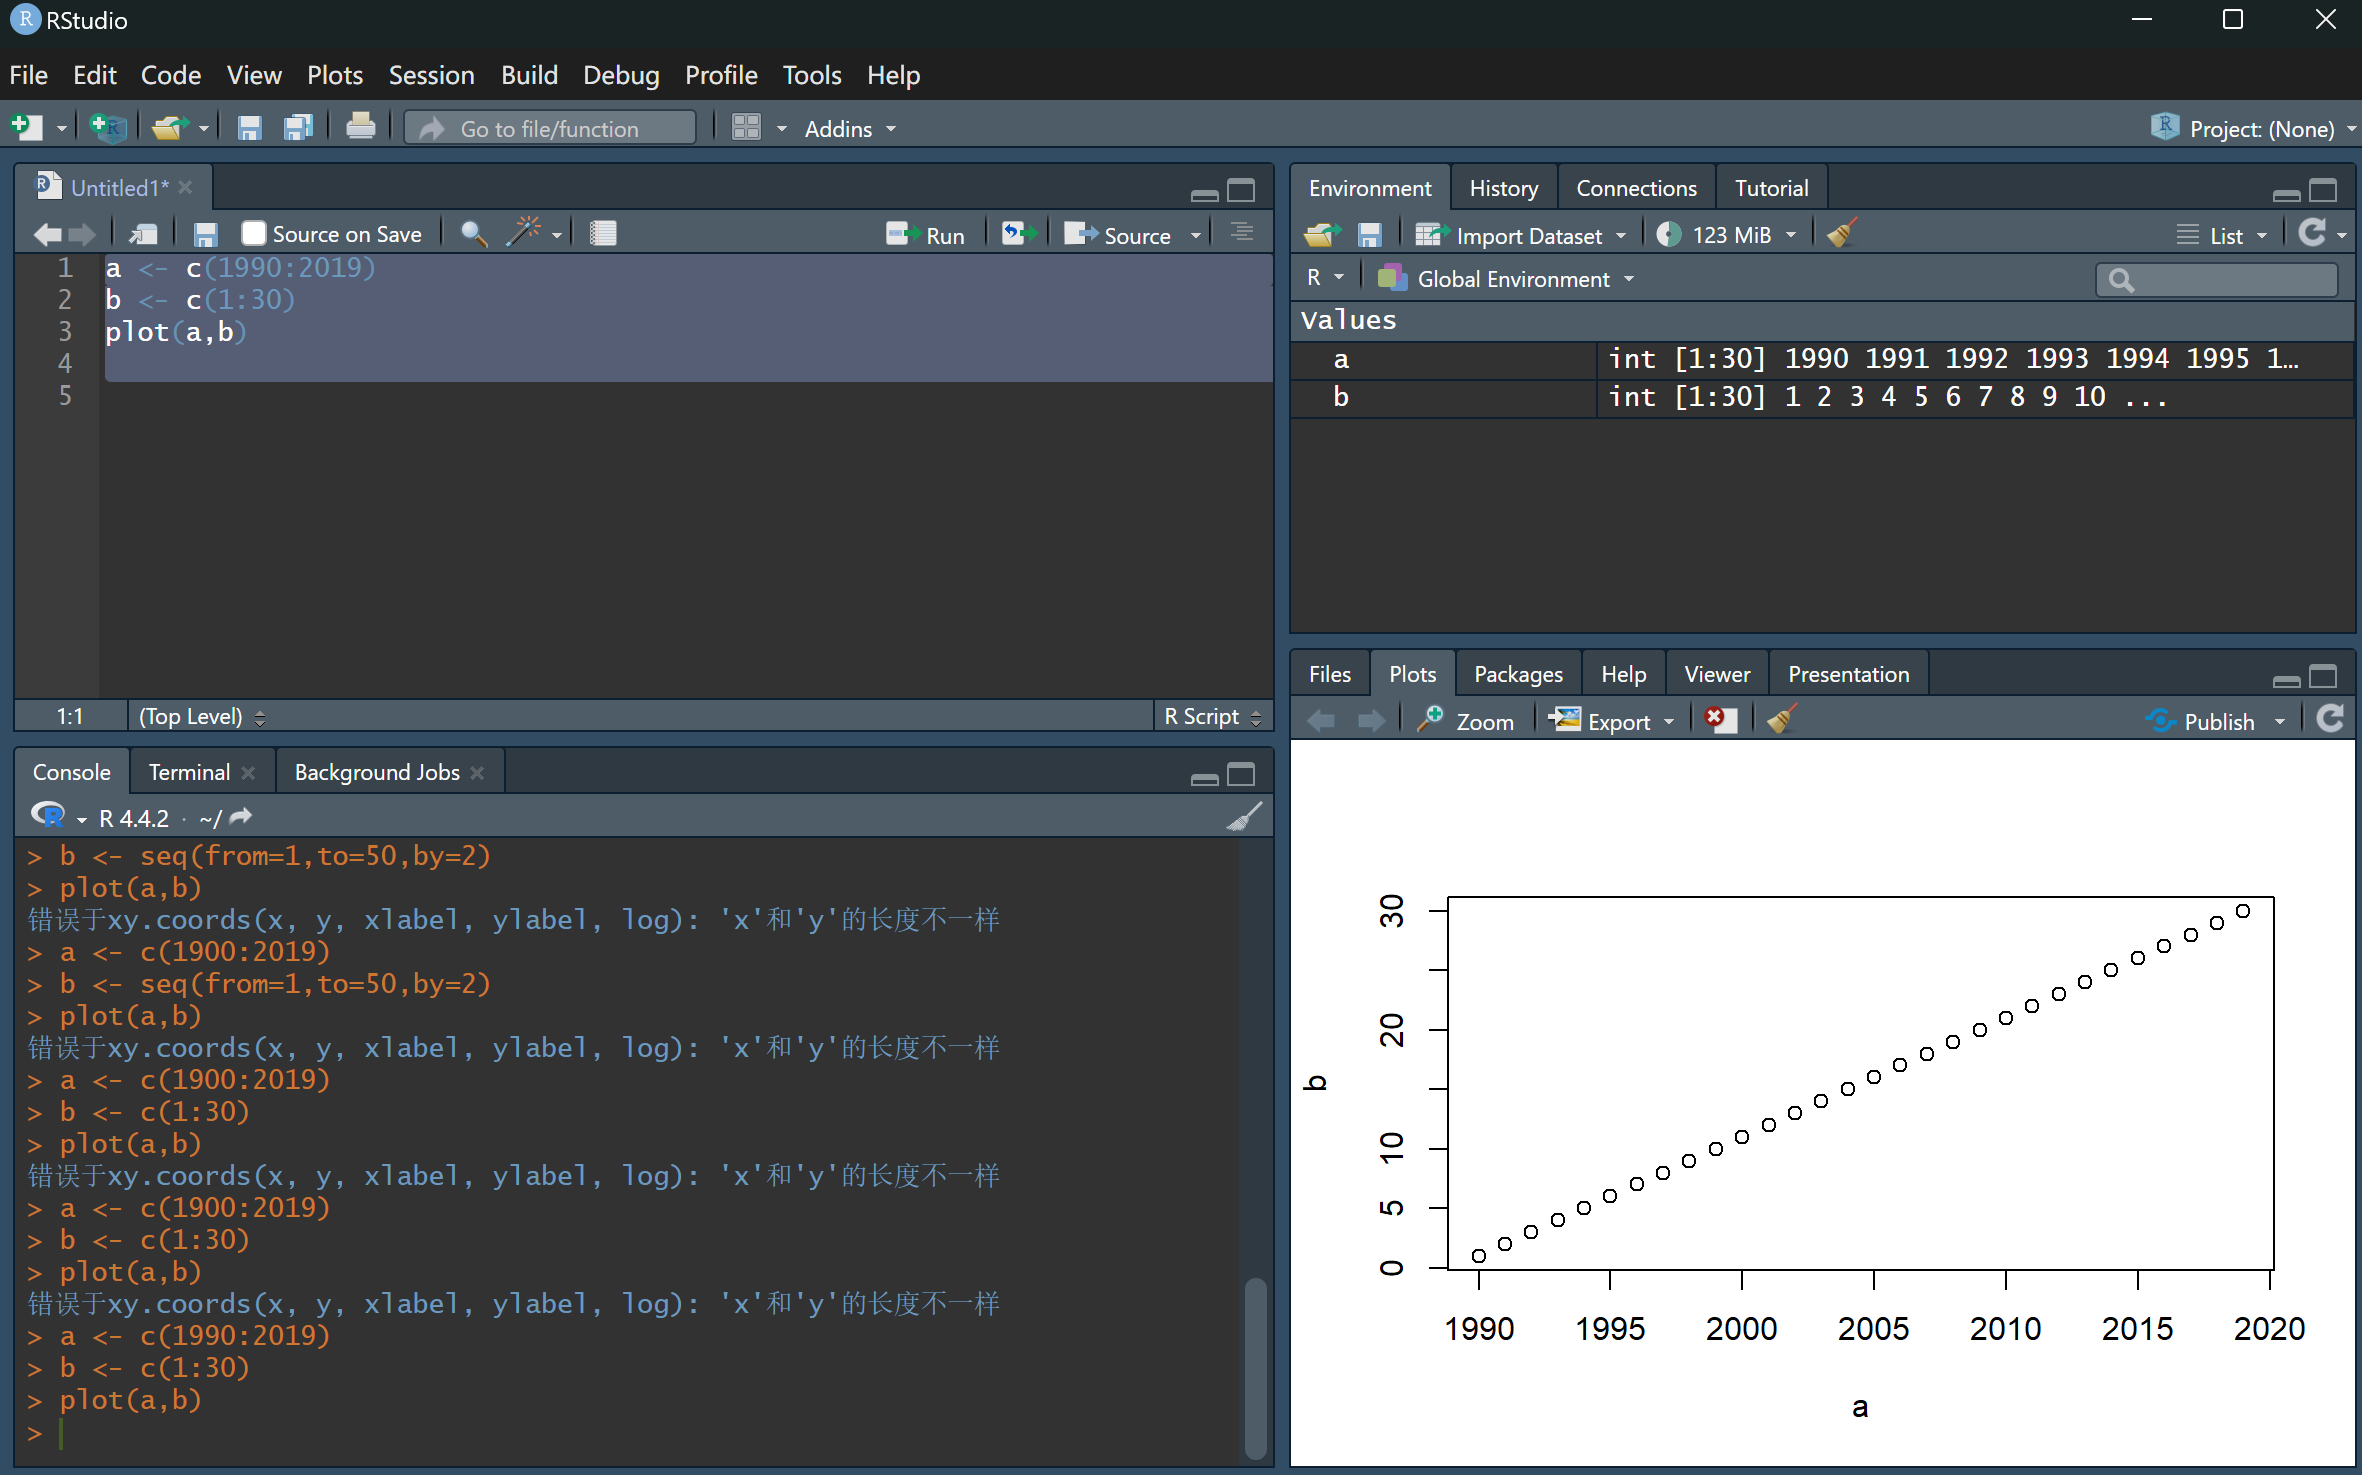
a <- c(1990:2019)
b <- c(1:30)
plot(a,b)

但结果不对
I don't see any problem with the code in your image. If you meant to post a video, it didn't work. Please describe your problem.
I typed in these codes yesterday and it replied like this(> a <- c(1900:2019)
b <-seq(from=1,to=50,by=2)
plot(a,b)
错误于xy.coords(x, y, xlabel, ylabel, log): 'x'和'y'的长度不一样)
But today I tried it again and it worked, I don't know what the problem is
I tried it and it didn't work. Can you post a screenshot of it working? Are you learning the plot() function because the a and b assignments are different? It doesn't work because the syntax requires equal amounts of a and b.
This topic was automatically closed 90 days after the last reply. New replies are no longer allowed.
If you have a query related to it or one of the replies, start a new topic and refer back with a link.