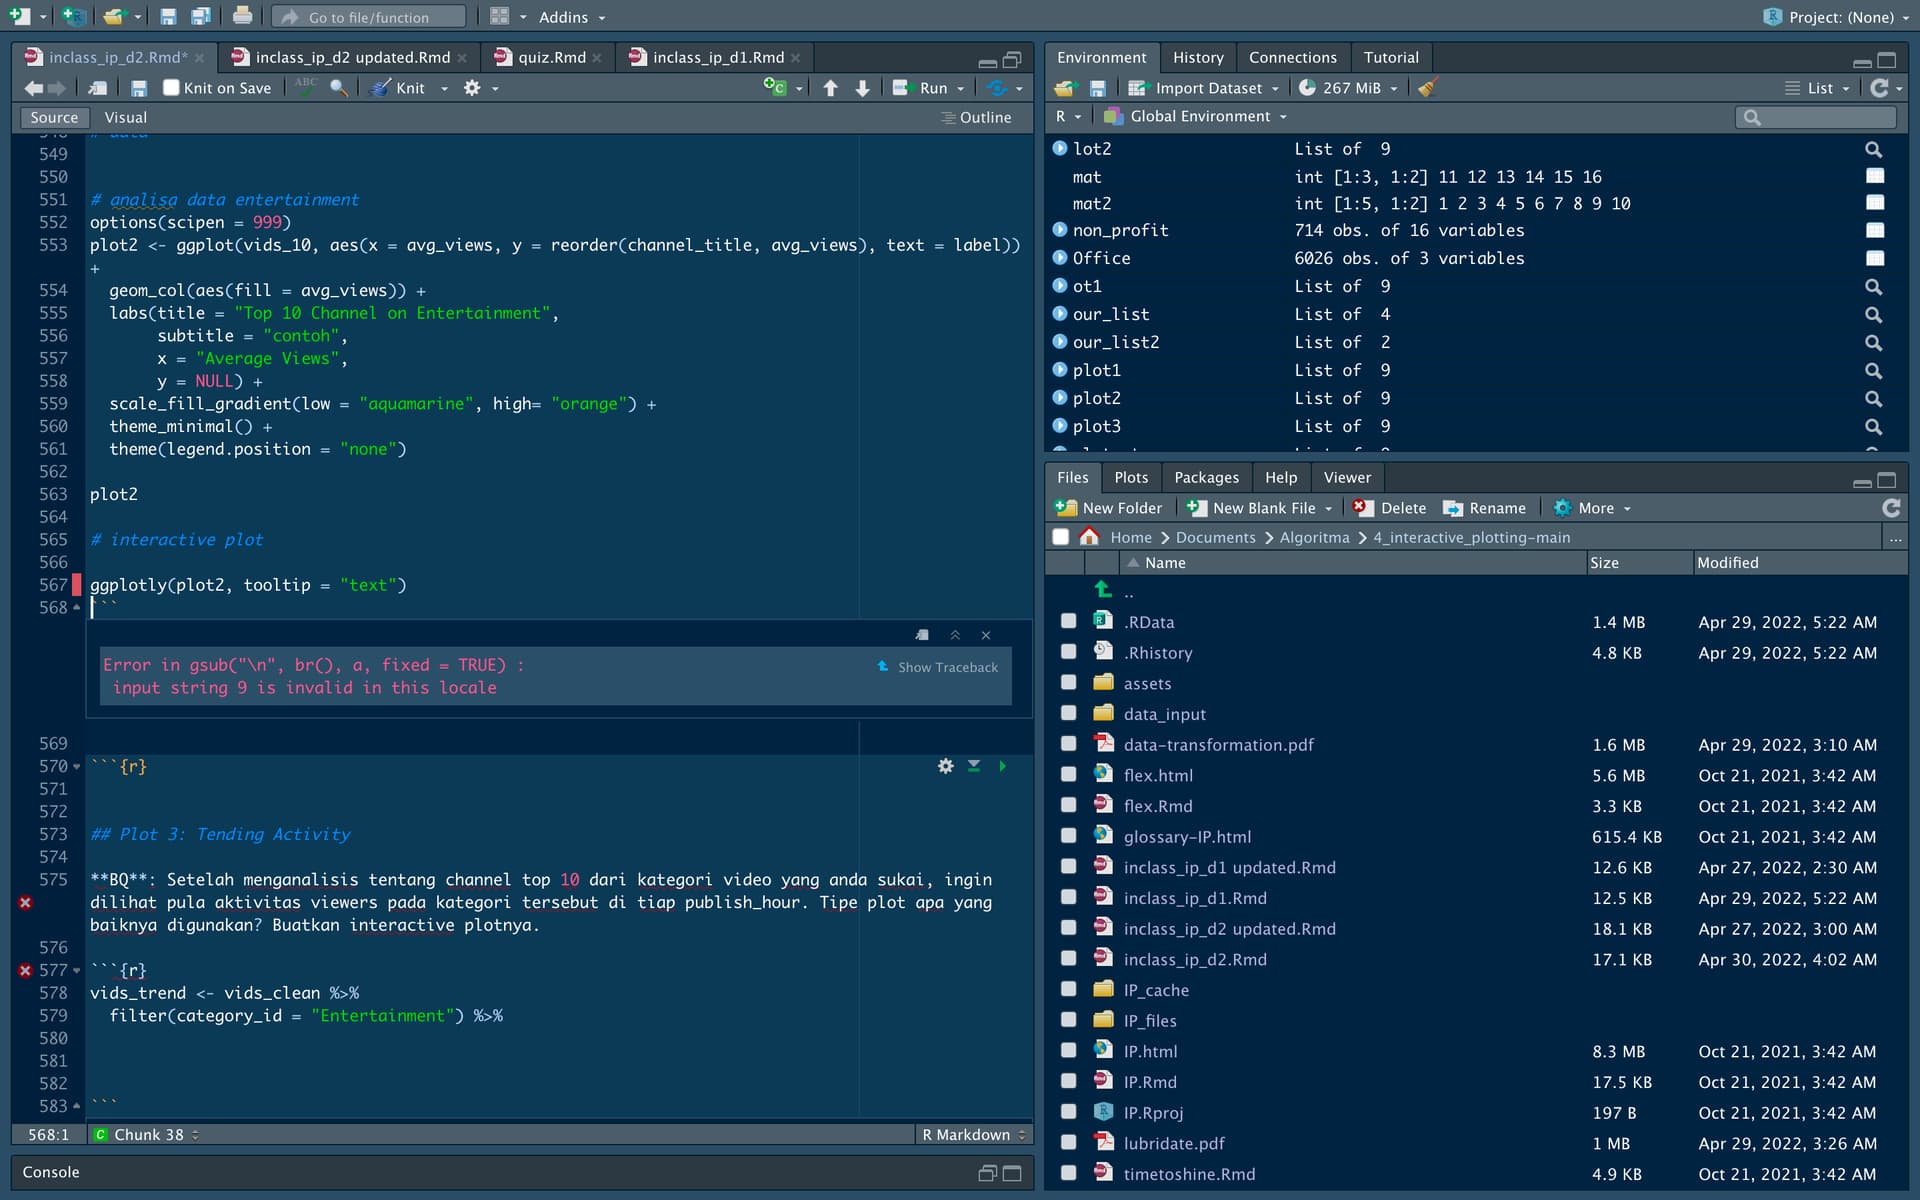
hi, i cant make interactive plot with ggplotly and I found this command : Error in gsub("\n", br(), a, fixed = TRUE) :
input string 9 is invalid in this locale. thank you
Hi, can you post the code, not the screenshot? Also, can you make the example reproducible? It will make it easier for people to help you.
plot2 <- ggplot(vids_10, aes(x = avg_views, y = reorder(channel_title, avg_views), text = label)) +
geom_col(aes(fill = avg_views)) +
labs(title = "Top 10 Channel on Entertainment",
subtitle = "contoh",
x = "Average Views",
y = NULL) +
scale_fill_gradient(low = "aquamarine", high= "orange") +
theme_minimal() +
theme(legend.position = "none")
plot2
ggplotly(plot2, tooltip = "text")
object 'vids_10' not found. I recommend that you take williaml's advice to provide a minimal reproducible example