linear regression of concentration by year.") +
- theme_classic() +
- scale_color_manual(labels=c("CH4 (ppb)", "CO2 (ppm)", "N20 (ppb)"),
-
values=c("Red", "Black", "Blue"))
Error in greenhouse_gases %>% ggplot(aes(x = year, y = Concentration, :
could not find function "%>%"
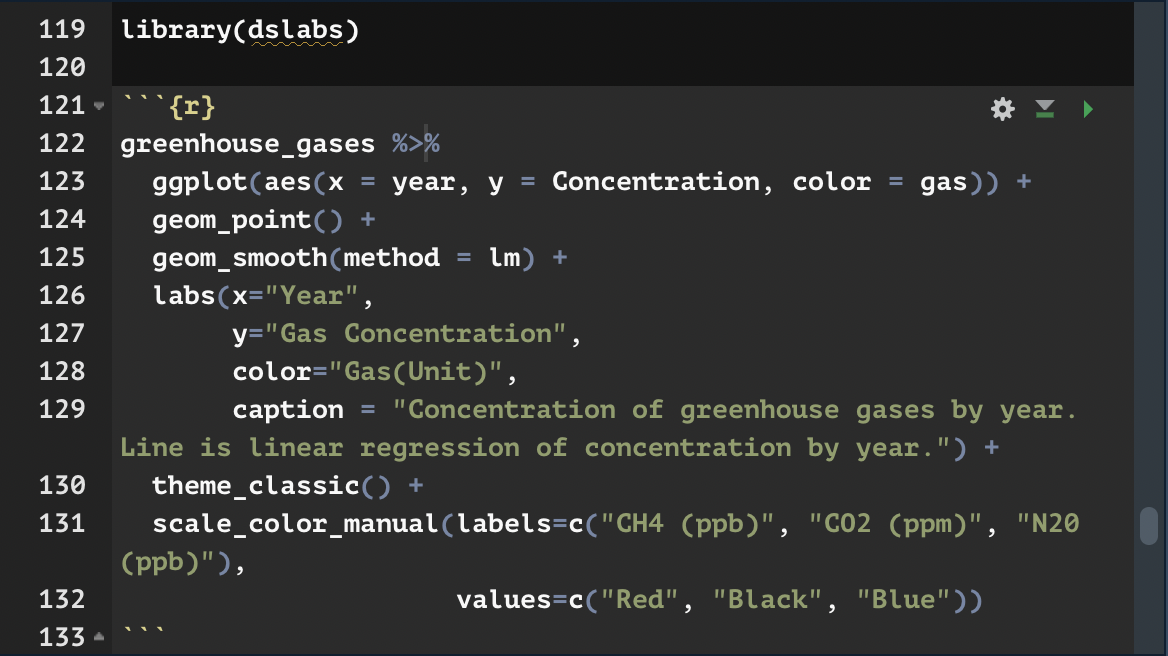
greenhouse_gases %/%
- ggplot(aes(x = year, y = Concentration, color = gas)) +
- geom_point() +
- geom_smooth(method = lm) +
- labs(x="Year",
-
y="Gas Concentration", -
color="Gas(Unit)", -
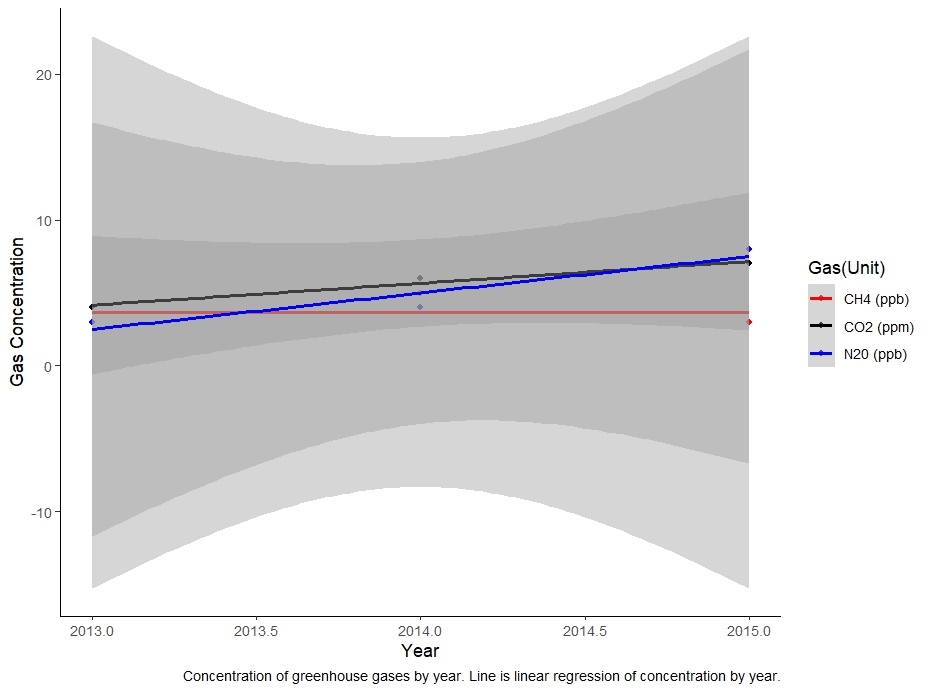
caption = "Concentration of greenhouse gases by year. Line is linear regression of concentration by year.") + - theme_classic() +
- scale_color_manual(labels=c("CH4 (ppb)", "CO2 (ppm)", "N20 (ppb)"),
-
values=c("Red", "Black", "Blue"))
Error in fortify():
! data must be a <data.frame>, or an object
coercible by fortify(), or a valid <data.frame>-like
object coercible by as.data.frame(), not a
object.
![]() Did you accidentally pass
Did you accidentally pass aes() to the data
argument?
Backtrace:
- ggplot2::ggplot(aes(x = year, y = Concentration, color = gas))
- ggplot2:::ggplot.default(aes(x = year, y = Concentration, color = gas))
- ggplot2:::fortify.default(data, ...)