You are just providing sample data but not your code, this would be a proper reproducible example
library(tidyverse)
library(viridis)
squad <- data.frame(
S001_Hpy_226 = c(0.158239735,-0.72434794,0.089073079,
-0.3024,-0.693858246,-0.862108287,-0.907549161,
-0.702547239,-0.763875498,-0.702547239,-1,-0.953507045,
-0.930462372,-0.866629603,-0.817167359,-0.844072846,-0.826116337,
-0.715614182,-0.659278348),
S001_Hpy_365 = c(-0.800922515,-1,-0.91459096,
-0.843520101,-0.67333103,-0.687492995,-0.645018216,-0.616720207,
-0.503675749,-0.602576747,-0.362700502,-0.404954688,
-0.687492995,-0.687492995,-0.687492995,-0.531914773,
-0.645018216,-0.560168509,-0.517793423),
S001_Hpy_813 = c(-0.752463016,-0.648522809,
-0.563822428,-0.460712104,-0.451360743,-0.404659328,-0.246558809,
-0.181762511,-0.218767428,-0.107923999,-0.135586765,
-0.163281518,-0.061890168,0.048232795,0.057387036,0.08482896,
0.130496397,0.15785557,0.15785557),
S001_Sad_292 = c(-0.93976707,-0.93976707,-0.93976707,
-0.93976707,-0.93976707,-0.93976707,-0.875028736,-1,
-0.945999821,-0.9174729,-0.960333894,-0.858632813,
-0.756931732,-0.692259666,-0.79134374,NA,NA,NA,NA),
S001_Sad_293 = c(-0.001246463,-0.023306738,-0.10638315,
-0.062006546,-0.056470619,0.064701532,0.124850672,
0.031770998,0.070181552,-0.001246463,0.042757468,-0.045406161,
0.037265439,0.031770998,-0.028827915,0.048247088,
-0.001246463,-0.017788007,0.009769058),
S001_Sad_296 = c(0.491402485,0.491402485,0.462683871,
-0.537315191,-0.960095522,-1,-0.960095522,-0.799779713,
-0.87182271,-0.80454135,-0.161680614,0.131739946,
-0.072512418,-0.182190415,-0.084570736,-0.248453764,-0.157589716,
-0.024588741,-0.048489138),
S001_Ang_278 = c(0.073815246,-0.68703515,-0.77005166,
-0.93816113,-0.846116383,-0.73978531,-0.574907058,
-0.582344331,0.261077799,NA,NA,NA,NA,NA,NA,NA,NA,NA,NA)
)
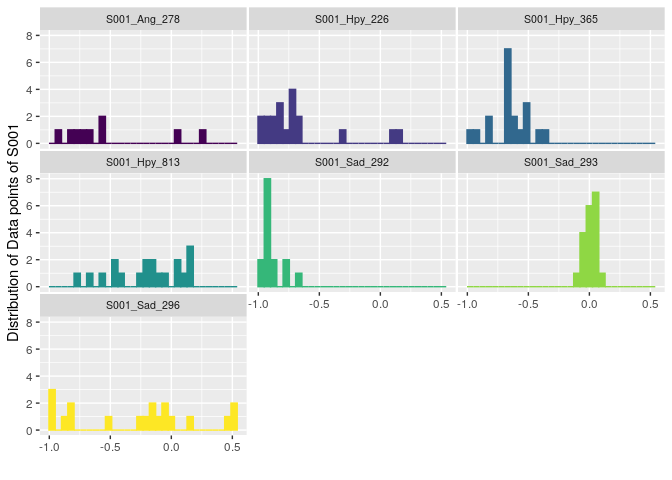
squad %>%
gather(key = "text", value = "value") %>%
ggplot(aes(x = value, color = text, fill = text)) +
geom_histogram() +
scale_fill_viridis(discrete = TRUE) +
scale_color_viridis(discrete = TRUE) +
theme(legend.position = "none",
panel.spacing = unit(0.1,"lines"),
strip.text.x =element_text(size=8)
) +
xlab("") +
ylab("Distribution of Data points of S001") +
facet_wrap(~text)
Created on 2020-03-26 by the reprex package (v0.3.0.9001)
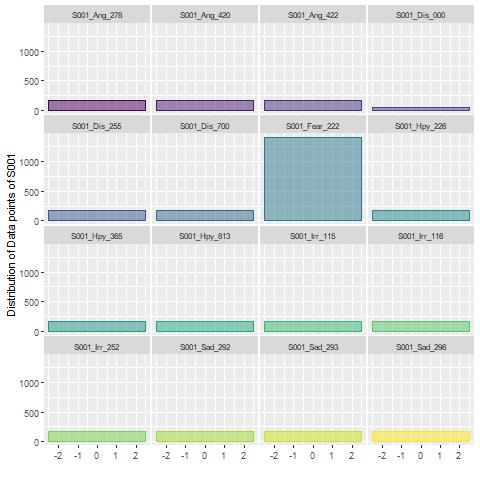
Is this what you want to do?