`#installed the package
install.packages("ggplot2")
library(ggplot2)
library(tidyverse)
#Task1: finding how rating varies in Amazon vs Non-Amazon products
task1 <- research_task %>%
group_by(amazon,date) %>%
summarise(q1= mean(rating))
ploted <- qplot(task1$date,task1$q1, color= task1$amazon)
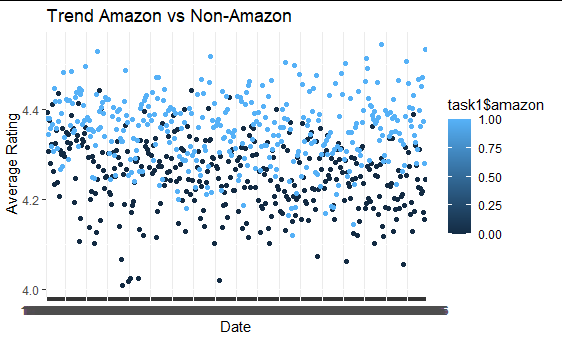
ploted + ggtitle("Trend Amazon vs Non-Amazon") +
xlab("Date") + ylab(" Average Rating")+ geom_smooth(method="lm") +
geom_point(size=1.5)
`
As you can see the scatter plot is fine however I am unable to draw a regression line? Any solutions?
The error shown is this geom_smooth() using formula 'y ~ x'
That is not an error message, just an informative message. To help us help you, could you please prepare a reproducible example (reprex) illustrating your issue? Please have a look at this guide, to see how to create one: