diabetes <- read.csv("https://raw.githubusercontent.com/malcolmbarrett/au-stats412-612-01-reading_data/master/diabetes.csv")
just_height <- diabetes[, "height"]
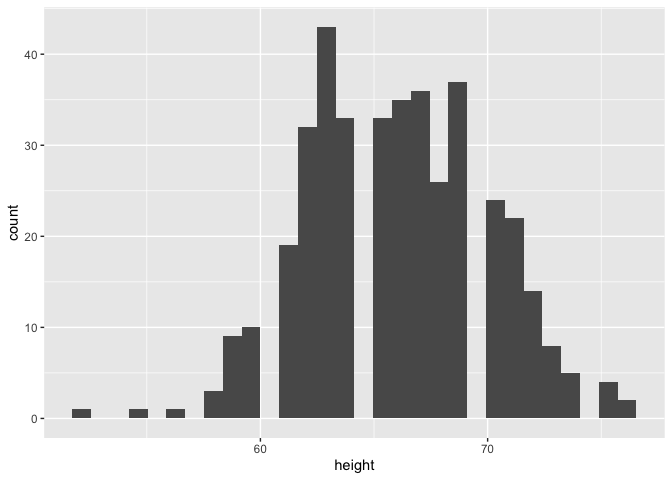
ggplot(just_height, aes(x = height)) +
geom_histogram()
Because you select only one column the one-column data.frame is converted to integer.
Annoying I think. Avoid this by specifying
just_height <- diabetes[, "height",drop=FALSE]
There is no need to create a vector with just the "height" variable; aes(x = height) is enough.
library(ggplot2)

diabetes <- read.csv("https://raw.githubusercontent.com/malcolmbarrett/au-stats412-612-01-reading_data/master/diabetes.csv")
ggplot(diabetes, aes(x = height)) +
  geom_histogram()
#> `stat_bin()` using `bins = 30`. Pick better value with `binwidth`.
#> Warning: Removed 5 rows containing non-finite values (`stat_bin()`).
Created on 2022-11-28 with reprex v2.0.2
1 Like
This topic was automatically closed 42 days after the last reply. New replies are no longer allowed.
If you have a query related to it or one of the replies, start a new topic and refer back with a link.