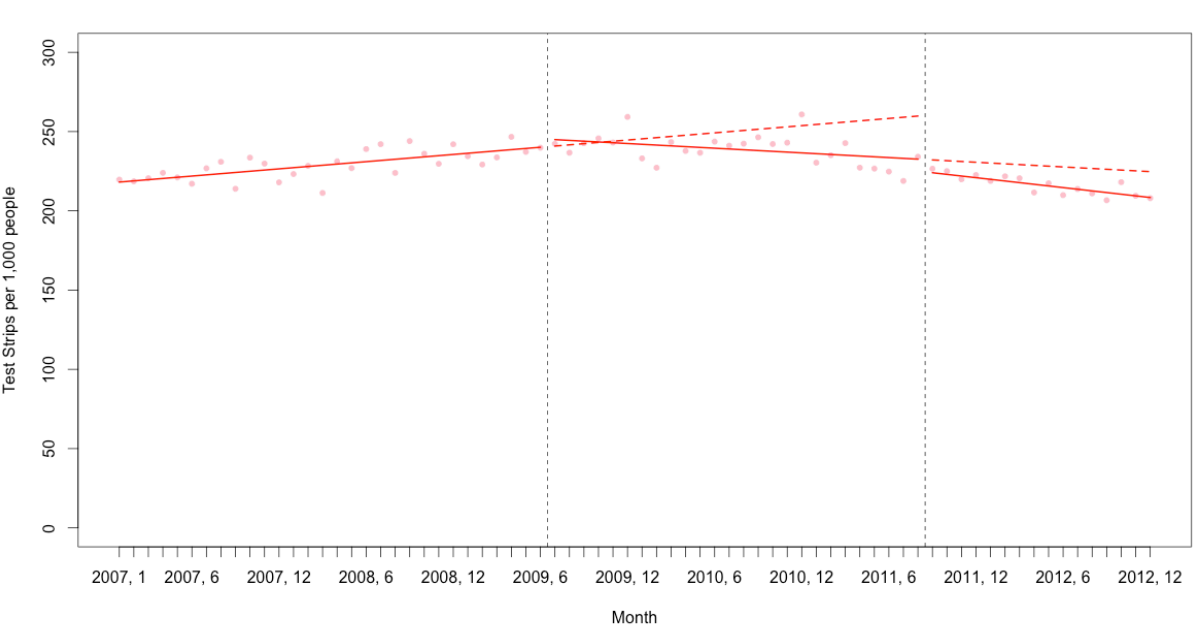
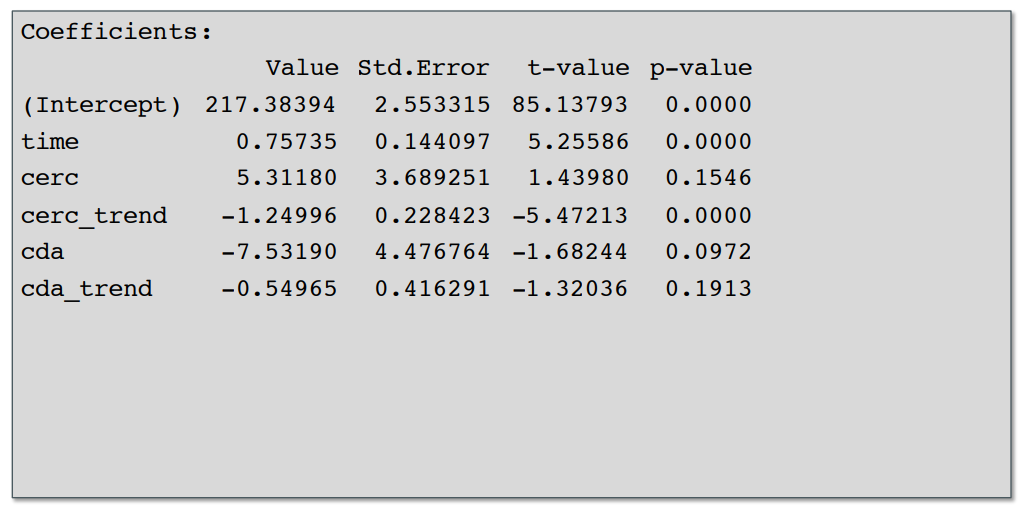
Hi, for a project I'm doing an interrupted time series analysis using a segmented linear regression. I'm trying to show that the trend (or slope) change after the first intervention (the first dotted line) was counteracted by the trend (or slope) change after the second intervention, i.e. that the trend/slope in the post-2nd intervention period returned to what it was before the 1st intervention. In picture form my data and model results look similar to this (these are just toy examples from a lecture I went to), except my two _trend variables are something like 7.43 for the first and -7.55 for the second interruption:
Can anyone suggest how I should go about this, particularly in R? I think I can get the linear combination of the two trend coefficients and that should give me what I need (I would also like confidence intervals for this)? How do I operationalize this as R code?
Thank you.