how understand why the reactive function works with tableoutput, but not with the plotoutput

df<-df %>% 
mutate(Tipologia_Ateneo = ifelse(grepl("telematica", AteneoNOME, ignore.case = TRUE), "telematica", "Tradizionale"))%>% 
filter(AnnoA>"2003/2004") 
scelte<-c("Dal più recente","Dal meno recente")
ordine_anni <- reactive({
    if (input$crono == "Dal più recente") {
      df %>% arrange(desc(AnnoA))
    } else {
      df %>% arrange(AnnoA)
    }
  })

selectInput(inputId ="crono",label = "Ordine cronologico",scelte)
checkboxInput("check_button","Mostra le etichette", value = FALSE)
plotOutput("grafico")
tableOutput("test")

output$test<-renderTable(ordine_anni())
output$grafico<-renderPlot({
  
  df_ordinato <-ordine_anni()
  
  tradizionali<-df_ordinato %>% filter(Tipologia_Ateneo=="Tradizionale") %>%
  group_by(AnnoA) %>% summarise(Immatricolazioni_TOT=sum(Isc)) 
  

limsup=max(tradizionali$Immatricolazioni_TOT)

trad<-tradizionali%>% 
  ggplot(aes(y=AnnoA,x=Immatricolazioni_TOT)) +
  theme_minimal()+
  theme(
    axis.text.y = element_text(hjust = 0.5),
        panel.grid.major.x =element_line(),
        panel.grid.minor.x = element_blank(),
        panel.grid.major.y = element_blank())+
  ylab("")+
  xlab("Immatricolazioni annuali università tradizionali ")+
  xlim(0,limsup)+
  scale_y_discrete(position = "right")+
  
  scale_x_reverse()+
  geom_col(fill="deepskyblue2", width = .8)+
  ggtitle(expression(bold(paste("Comparazione tra le immatricolazioni ad atenei universitari tradizionali ", " e ", "ad atenei universitari telematici "))), "* I dati raccolti rappresentano le immatricolazioni per anno accademico dal 2004 al 2022 provenienti dal portale del ministero:https://dati-ustat.mur.gov.it/dataset/iscritti" )+
if(input$check_button)
{
  geom_text(aes(label=Immatricolazioni_TOT), size=2.5, hjust = -0.2,color="white")
}

tele<-df_ordinato %>% filter(Tipologia_Ateneo=="telematica") %>% 
  group_by(AnnoA) %>%
  summarise(Immatricolazioni_TOT=sum(Isc)) %>% 
  ggplot(aes(y=AnnoA,x=Immatricolazioni_TOT)) +
  ylab("")+
  scale_y_discrete(position = "left")+
  scale_x_continuous(limits =c(0,limsup))+
    theme_minimal()+
  theme(axis.title.y =element_blank(),
        axis.text.y=element_blank(),
        panel.grid.major.x =element_blank(),
        panel.grid.minor.x = element_line(),
        panel.grid.major.y = element_blank())+
   xlab("Immatricolazioni annuali università telematiche ")+
geom_col(fill="seagreen", width = .8)+
if(input$check_button)
{
geom_text(aes(label=Immatricolazioni_TOT), size=2.5,color="seagreen",hjust =-0.2)
}


trad + tele


})

Hi @Campagnoli ,

There are folks here who might be able to troubleshoot based only on the code you've shared, but it would be helpful if you also shared the contents of df — is that something you are in a position to do?

here's the css file, thank you!

Thanks, @Campagnoli — rather than share a file, the usual way to share data here is to supply a command that folks here can copy and run to recreate your table df. If df has, say, fewer than a couple hundred rows, you would run the command:

dput(df)

and otherwise, you would run the command:

dput(head(df, 100))

and then you would paste the dput() output here, in a code block. Could you do that?

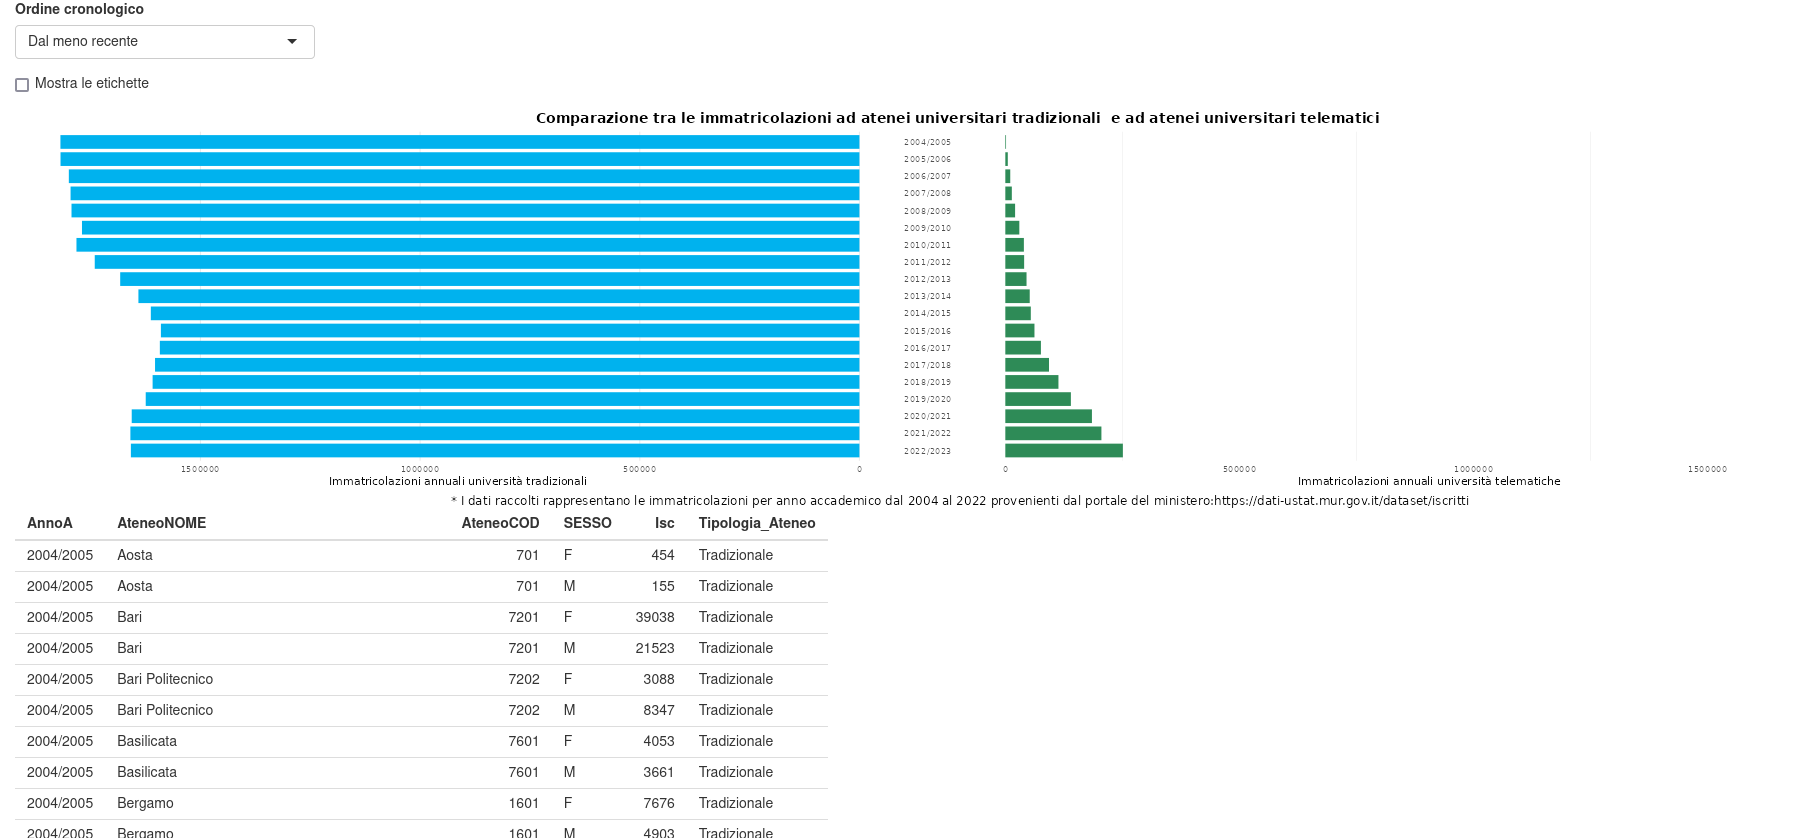
structure(list(AnnoA = c("2022/2023", "2022/2023", "2022/2023", 
"2022/2023", "2022/2023", "2022/2023", "2022/2023", "2022/2023", 
"2022/2023", "2022/2023", "2022/2023", "2022/2023", "2022/2023", 
"2022/2023", "2022/2023", "2022/2023", "2022/2023", "2022/2023", 
"2022/2023", "2022/2023", "2022/2023", "2022/2023", "2022/2023", 
"2022/2023", "2022/2023", "2022/2023", "2022/2023", "2022/2023", 
"2022/2023", "2022/2023", "2022/2023", "2022/2023", "2022/2023", 
"2022/2023", "2022/2023", "2022/2023", "2022/2023", "2022/2023", 
"2022/2023", "2022/2023", "2022/2023", "2022/2023", "2022/2023", 
"2022/2023", "2022/2023", "2022/2023", "2022/2023", "2022/2023", 
"2022/2023", "2022/2023", "2022/2023", "2022/2023", "2022/2023", 
"2022/2023", "2022/2023", "2022/2023", "2022/2023", "2022/2023", 
"2022/2023", "2022/2023", "2022/2023", "2022/2023", "2022/2023", 
"2022/2023", "2022/2023", "2022/2023", "2022/2023", "2022/2023", 
"2022/2023", "2022/2023", "2022/2023", "2022/2023", "2022/2023", 
"2022/2023", "2022/2023", "2022/2023", "2022/2023", "2022/2023", 
"2022/2023", "2022/2023", "2022/2023", "2022/2023", "2022/2023", 
"2022/2023", "2022/2023", "2022/2023", "2022/2023", "2022/2023", 
"2022/2023", "2022/2023", "2022/2023", "2022/2023", "2022/2023", 
"2022/2023", "2022/2023", "2022/2023", "2022/2023", "2022/2023", 
"2022/2023", "2022/2023"), AteneoNOME = c("Aosta", "Aosta", "Bari", 
"Bari", "Bari Politecnico", "Bari Politecnico", "Basilicata", 
"Basilicata", "Benevento Giustino Fortunato - telematica", "Benevento Giustino Fortunato - telematica", 
"Bergamo", "Bergamo", "Bologna", "Bologna", "Bolzano", "Bolzano", 
"Bra Scienze Gastronomiche", "Bra Scienze Gastronomiche", "Brescia", 
"Brescia", "Ca' Foscari Venezia", "Ca' Foscari Venezia", "Cagliari", 
"Cagliari", "Calabria", "Calabria", "Camerino", "Camerino", "Casamassima - G.Degennaro", 
"Casamassima - G.Degennaro", "Cassino", "Cassino", "Castellanza LIUC", 
"Castellanza LIUC", "Catania", "Catania", "Catanzaro", "Catanzaro", 
"Chieti e Pescara", "Chieti e Pescara", "Enna KORE", "Enna KORE", 
"Ferrara", "Ferrara", "Firenze", "Firenze", "Firenze IUL - telematica", 
"Firenze IUL - telematica", "Foggia", "Foggia", "Genova", "Genova", 
"Insubria", "Insubria", "L'Aquila", "L'Aquila", "Macerata", "Macerata", 
"Marche", "Marche", "Messina", "Messina", "Milano", "Milano", 
"Milano Bicocca", "Milano Bicocca", "Milano Bocconi", "Milano Bocconi", 
"Milano Cattolica", "Milano Cattolica", "Milano IULM", "Milano IULM", 
"Milano Politecnico", "Milano Politecnico", "Milano San Raffaele", 
"Milano San Raffaele", "Modena e Reggio Emilia", "Modena e Reggio Emilia", 
"Molise", "Molise", "Napoli Benincasa", "Napoli Benincasa", "Napoli Federico II", 
"Napoli Federico II", "Napoli L'Orientale", "Napoli L'Orientale", 
"Napoli Parthenope", "Napoli Parthenope", "Napoli Pegaso - telematica", 
"Napoli Pegaso - telematica", "Napoli Vanvitelli", "Napoli Vanvitelli", 
"Novedrate e-Campus - telematica", "Novedrate e-Campus - telematica", 
"Padova", "Padova", "Palermo", "Palermo", "Parma", "Parma"), 
    AteneoCOD = c(701L, 701L, 7201L, 7201L, 7202L, 7202L, 7601L, 
    7601L, 6202L, 6202L, 1601L, 1601L, 3701L, 3701L, 2101L, 2101L, 
    401L, 401L, 1701L, 1701L, 2701L, 2701L, 9201L, 9201L, 7801L, 
    7801L, 4302L, 4302L, 7203L, 7203L, 6001L, 6001L, 1201L, 1201L, 
    8701L, 8701L, 7901L, 7901L, 6901L, 6901L, 8601L, 8601L, 3801L, 
    3801L, 4801L, 4801L, 4804L, 4804L, 7101L, 7101L, 1001L, 1001L, 
    1202L, 1202L, 6601L, 6601L, 4301L, 4301L, 4201L, 4201L, 8301L, 
    8301L, 1501L, 1501L, 1509L, 1509L, 1503L, 1503L, 1504L, 1504L, 
    1505L, 1505L, 1502L, 1502L, 1508L, 1508L, 3601L, 3601L, 7001L, 
    7001L, 6304L, 6304L, 6301L, 6301L, 6303L, 6303L, 6302L, 6302L, 
    6307L, 6307L, 6306L, 6306L, 1301L, 1301L, 2801L, 2801L, 8201L, 
    8201L, 3401L, 3401L), SESSO = c("F", "M", "F", "M", "F", 
    "M", "F", "M", "F", "M", "F", "M", "F", "M", "F", "M", "F", 
    "M", "F", "M", "F", "M", "F", "M", "F", "M", "F", "M", "F", 
    "M", "F", "M", "F", "M", "F", "M", "F", "M", "F", "M", "F", 
    "M", "F", "M", "F", "M", "F", "M", "F", "M", "F", "M", "F", 
    "M", "F", "M", "F", "M", "F", "M", "F", "M", "F", "M", "F", 
    "M", "F", "M", "F", "M", "F", "M", "F", "M", "F", "M", "F", 
    "M", "F", "M", "F", "M", "F", "M", "F", "M", "F", "M", "F", 
    "M", "F", "M", "F", "M", "F", "M", "F", "M", "F", "M"), Isc = c(688L, 
    268L, 24869L, 15103L, 2980L, 6775L, 3516L, 2256L, 1246L, 
    842L, 11827L, 7476L, 47697L, 36984L, 2643L, 1238L, 152L, 
    176L, 7159L, 7970L, 12010L, 6957L, 14153L, 9507L, 13417L, 
    9610L, 2807L, 2902L, 793L, 929L, 3602L, 3381L, 919L, 1786L, 
    21059L, 15488L, 6644L, 4134L, 13723L, 7374L, 3400L, 1485L, 
    15722L, 10333L, 31555L, 22057L, 922L, 398L, 8463L, 4649L, 
    17655L, 13652L, 6233L, 5181L, 8468L, 7514L, 6836L, 2362L, 
    6923L, 7932L, 14771L, 8918L, 34749L, 24150L, 21964L, 13605L, 
    5695L, 7960L, 28183L, 14044L, 5949L, 1746L, 16659L, 30897L, 
    2970L, 1513L, 13716L, 11997L, 3989L, 2499L, 7355L, 1246L, 
    40274L, 31525L, 7801L, 1978L, 4993L, 7003L, 46233L, 44089L, 
    13725L, 9088L, 25891L, 20769L, 37505L, 31207L, 24737L, 16761L, 
    17484L, 12180L)), row.names = c(NA, 100L), class = "data.frame")

Sorry but it's one of my first time with R and I have to learn quite everything about also the community.

Thank you!

1 Like

Thanks, @Campagnoli !

The table you shared has no column called Tipologia_Ateneo, so the plotting code fails. If this table is identical (except for tows) to the table you're using in your app, that would explain why no plot it produced.

yes because I've created the column by this code:

df<-df %>% 
mutate(Tipologia_Ateneo = ifelse(grepl("telematica", AteneoNOME, ignore.case = TRUE), "telematica", "Tradizionale"))%>% 
filter(AnnoA>"2003/2004") 
scelte<-c("Dal più recente","Dal meno recente")

it shows the graph, but the reactive function doesn't work.
Instead it works for the tableoutput

1 Like

I'm going to guess, that you expect something visual in your chart to change, when the data.frame its made from has the same content but has its rows in a reversed order ? thats probably a false assumption.
If you want something to be reordered, the data should change, perhaps you need to create a factor with an opposite ordering , or else flip a scale or something.

Sorry — I completely missed copying your very first code block! Splitting code up in blocks is good for readability, and you can also paste it all in one block at the end for absent-minded people like me.

OK, looking it over now, it looks like this is the error (or errors, since the code for tele includes the same conditional statement):

What happens if you move the opening brace ({) to the end of the previous line, like this?

if (input$check_button) {
  geom_text(aes(label=Immatricolazioni_TOT), size=2.5,color="seagreen",hjust =-0.2)
}

I'm seeing this plot for trad:


and this plot for tele:

Each one is a separate ggplot plot which you appear to be adding together with

trad + tele

being the returned object from the renderPlot(). You can't + together two separate ggplot objects plots, but you can use other methods to combine multiple separate ggplots into a single object if that's what you are intending?

You can as long as you've loaded the patchwork package, which is what I assumed @Campagnoli had done in code he hadn't shared, but maybe that's missing, too.

@Campagnoli Could you sketch out or roughly photoshop for us what you expect the plot to look like please?

Thank you
Nothing, the check button is working,
The problem is the select input , because my idea was if I selected "dal più recente" the Y axes should be reordered by the nearest year.
If I try to do this with the reactive function the y axis is fixed and I can't understand why. In fact the reactive funtcion is working for the render table...
I think the problem is near the ggplot and in the usage of the reactive function in the first graph.
near these line of codes, I think so .
I' not sure about the usage of
df_ordinato <-ordine_anni()
because it doesn't reorder the y axes.

output$grafico<-renderPlot({
  
  df_ordinato <-ordine_anni()
  
  tradizionali<-df_ordinato %>% filter(Tipologia_Ateneo=="Tradizionale") %>%
  group_by(AnnoA) %>% summarise(Immatricolazioni_TOT=sum(Isc)) 
  

limsup=max(tradizionali$Immatricolazioni_TOT)

trad<-tradizionali%>% 
  ggplot(aes(y=AnnoA,x=Immatricolazioni_TOT)) +
  theme_minimal()+
  theme(
    axis.text.y = element_text(hjust = 0.5),
        panel.grid.major.x =element_line(),
        panel.grid.minor.x = element_blank(),
        panel.grid.major.y = element_blank())+
  ylab("")+
  xlab("Immatricolazioni annuali università tradizionali ")+
  xlim(0,limsup)+
  scale_y_discrete(position = "right")+
  
  scale_x_reverse()+
  geom_col(fill="deepskyblue2", width = .8)+
  ggtitle(expression(bold(paste("Comparazione tra le immatricolazioni ad atenei universitari tradizionali ", " e ", "ad atenei universitari telematici "))), "* I dati raccolti rappresentano le immatricolazioni per anno accademico dal 2004 al 2022 provenienti dal portale del ministero:https://dati-ustat.mur.gov.it/dataset/iscritti" )+
if(input$check_button){
  geom_text(aes(label=Immatricolazioni_TOT), size=2.5, hjust = -0.2,color="white")
  }


Thank you fir your time

Were you able to get the plots you wanted by running R (not shiny) code in RStudio, and then tried to "shiny-ize" the code? Or did you try to develop the plot code directly as shiny code?

I wrote as first as a normal r code and then as a shiny, and as R code is working

1 Like

So just to confirm, the plots look exactly as you expect in the non-shiny version of your code, is that right?

Yes, in the non shiny version all works, than the idea was to reorder the y axis where there is the year by the coiche of the select input

Are you trying to create this? Comments annotate the key areas I've edited

library(dplyr)
library(ggplot2)
library(ggpubr)
library(shiny)
library(forcats)

df <- read.csv("02_iscrittixateneo.csv", sep = ";")
df <- df %>%
  mutate(Tipologia_Ateneo = ifelse(
    grepl("telematica", AteneoNOME, ignore.case = TRUE),
    "telematica",
    "Tradizionale"
  )) %>%
  filter(AnnoA > "2003/2004")
scelte <- c("Dal più recente", "Dal meno recente")


ui <- fluidPage(
  selectInput(inputId = "crono", label = "Ordine cronologico", scelte),
  checkboxInput("check_button", "Mostra le etichette", value = FALSE),
  plotOutput("grafico"),
  tableOutput("test")
)

server <- function(input, output, session) {
  ordine_anni <- reactive({
    # Convert AnnoA to factor so ggplot displays in the correct order
    if (input$crono == "Dal più recente") {
      dat <- mutate(df, AnnoA = fct_rev(AnnoA))
    } else {
      dat <- mutate(df, AnnoA = factor(AnnoA))
    }
    # Sort by the factor's new levels
    arrange(dat, AnnoA)
  })

  output$test <- renderTable(ordine_anni())
  output$grafico <- renderPlot({
    df_ordinato <- ordine_anni()

    tradizionali <-
      df_ordinato %>% filter(Tipologia_Ateneo == "Tradizionale") %>%
      group_by(AnnoA) %>% summarise(Immatricolazioni_TOT = sum(Isc))

    limsup = max(tradizionali$Immatricolazioni_TOT)
    axis_margin <- 5.5

    trad <- tradizionali %>%
      ggplot(aes(y = AnnoA, x = Immatricolazioni_TOT)) +
      geom_col(fill = "deepskyblue2", width = .8) +
      theme_minimal() +
      theme(
        axis.text.y = element_text(hjust = 0.5),
        panel.grid.major.x = element_line(),
        panel.grid.minor.x = element_blank(),
        panel.grid.major.y = element_blank(),
        plot.margin = margin(axis_margin, 0, axis_margin, axis_margin)
      ) +
      ylab("") +
      xlab("Immatricolazioni annuali università tradizionali ") +
      xlim(0, limsup) +
      #limits=rev to reverse the ordering of how ggplot displays things on y-axis.
      scale_y_discrete(position = "right", limits = rev) +
      scale_x_reverse()

    if (input$check_button) {
      trad <- trad + geom_text(
        aes(label = Immatricolazioni_TOT),
        size = 2.5,
        hjust = -0.2,
        color = "white"
      )
    }

    tele <- df_ordinato %>% filter(Tipologia_Ateneo == "telematica") %>%
      group_by(AnnoA) %>%
      summarise(Immatricolazioni_TOT = sum(Isc)) %>%
      ggplot(aes(y = AnnoA, x = Immatricolazioni_TOT)) +
      ylab("") +
      scale_y_discrete(position = "left", limits = rev) +
      scale_x_continuous(limits = c(0, limsup)) +
      theme_minimal() +
      theme(
        axis.title.y = element_blank(),
        axis.text.y = element_blank(),
        panel.grid.major.x = element_blank(),
        panel.grid.minor.x = element_line(),
        panel.grid.major.y = element_blank(),
        plot.margin = margin(axis_margin, axis_margin, axis_margin, 0),
      ) +
      xlab("Immatricolazioni annuali università telematiche ") +
      geom_col(fill = "seagreen", width = .8)

    if (input$check_button) {
      tele <- tele + geom_text(
        aes(label = Immatricolazioni_TOT),
        size = 2.5,
        color = "seagreen",
        hjust = -0.2
      )
    }

    # Combine plots and add title
    plot <- ggarrange(trad, tele)
    plot <- annotate_figure(
      plot,
      top = text_grob(
        label = paste0(
          "Comparazione tra le immatricolazioni ad atenei universitari tradizionali ",
          " e ",
          "ad atenei universitari telematici "
        ),
        face = "bold",
        size = 14
      )
    )
    plot <- annotate_figure(
      plot,
      bottom = "* I dati raccolti rappresentano le immatricolazioni per anno accademico dal 2004 al 2022 provenienti dal portale del ministero:https://dati-ustat.mur.gov.it/dataset/iscritti"
    )
    return(plot)
  })
}

shinyApp(ui, server)

Yes, you saved me.
Thank u.
So my error was that I didn't convert to factor.
Thank u

ggplot displays character data types in alphabetical/numerical ordering, regardless of how you order the original data. If you need to display in a different order, convert character data to factor and control the factor levels to determine the ordering.

1 Like