Hi!
I am very new to R, so please bear with me. I am mostly used to Excel but need to use R due to the size of the dateset I am working with.
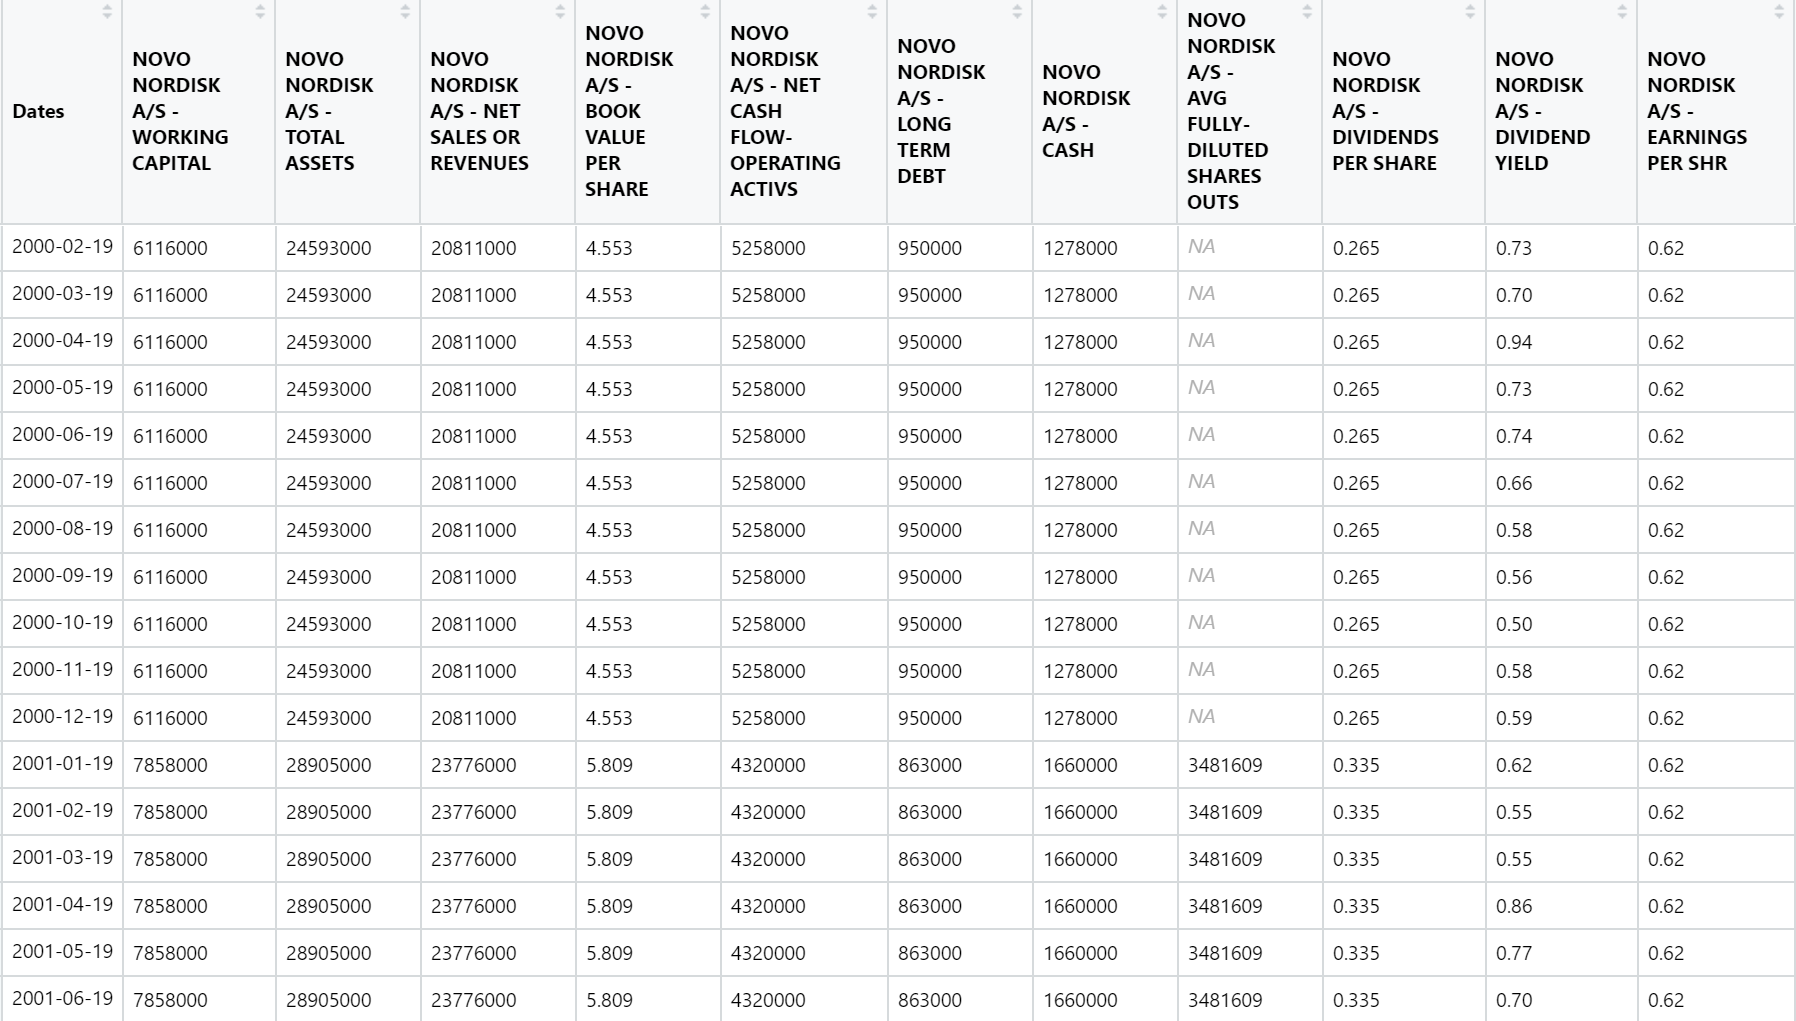
My dataset contains monthly observations of 15 different types of financial data (e.g. share price, dividend, earnings, etc.) for a large number (~8,000) stocks over a 25 year period. However, currently my dataset is two-dimensional such that the 15 types of data for stock 1 is in the first 15 columns, then the same data for stock 2 in columns 16-30, etc... you get the idea.
For each individual stock I need to be able create new vectors for each stock by multiplying current vectors, as well as creating new vectors for each stock based on the value of one of the vectors relative to the cross-section of stocks (e.g. is the stock in the top 10% of highest dividend yields in the sample).
Intuititvely I feel it would be optimal to have the data in "three dimensions" but is this feasible or even possible, and if yes, how would i optimally get to there? Or are there any other good ways to work around this when the dataset reaches this size (currently ~120,000 columns).
Thank you very much!