i am learning r programming, and i start a work on india corona dataset, but i want to visualize top 5 corona status in my geom_bar, so anybody can tell me how can i do this?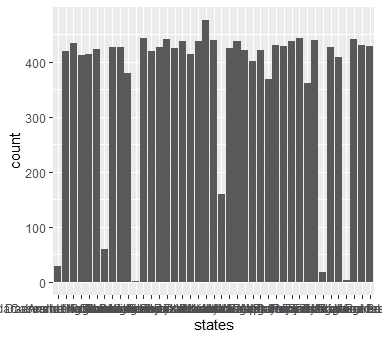 this is my geom_bar and i want to visualize top 5 status individual and min 5 status individual...so please help me to solve this... tutuappvip.co routingnumbers.onl
I think we need more information on just what you are looking for. We also probably need a reproducible example (reprex)
When you say "i want to visualize top 5 status individual and min 5 status individual" do you mean that you only want the top and bottom states displayed in the barchart or you wish to wish to display all states but highlight the top 10 and bottom 5 states?
i read your share link, and i think you are store a result in new dataframe and then you visualize a result top 5 rows, please correct if i am wrong
I am not sure what you mean here. If you want only the top 10 and bottom 5 states than that is probably the best thing to do. Do you want this?