How to vectorise my code and make faster loops in R.

Hi all,

I am trying to run a for loop for the below scenario

  1. I have 100k Unique customers in my transactional table which are going to n number of stores each customer.
  2. I am trying to loop through each customer and seeing in which unique store they are going and if new store has opened within 20 kms range to that store then he/she will go to that store and I will make their Value 1 in new data frame created.
  3. I am initializing my code in first for loop and then repeating the same for rest of my data frame.

My code is extremely slow with for loop. I don't know how to vectorise my code. Below is the snapshot of my code. Please guide me how to make this code faster and efficient.

EDIT : Added sample dataset now.

cust_id = c(unique(kk$Customer_ID))
i = cust_id[1]

# for initializing
s = c(0,0,0,0)
df_temp = kk[kk$Customer_ID == i]
store = c(unique(df_temp$Store_Code))


for (j in store){
  if(df_temp[Store_Code == j]$dist.km298 < 20) {
    s[1] <- 1
  } 
  if(df_temp[Store_Code == j]$dist.km299 < 20) {
    s[2] <- 1
  } 
  if(df_temp[Store_Code == j]$dist.km300 < 20) {
    s[3] <- 1
  } 
  if(df_temp[Store_Code == j]$dist.km301 < 20) {
    s[4] <- 1
  }
  
}

vishal <- data.frame("Customer_ID" = c(i,i,i,i) , "Store_Code" = c(60298,60299,60300,60301), "Prediction" = s)
cust_id <- cust_id[!cust_id %in% c(cust_id[1])]


# loop for all customers
count = 1
for (k in 1:length(cust_id)){
  i <- cust_id[k]
  # count <- count+1
  # if (count == 5) {
  #   break
  #}
  s = c(0,0,0,0)
  df_temp = kk[kk$Customer_ID == i]
  store = c(unique(df_temp$Store_Code))
  
  for (j in store){
    #if(df_temp$Store_Code == j & df_temp$Purchase_2016 != 0 & df_temp$Purchase_2017 == 0){
    if(df_temp[Store_Code == j]$dist.km298 < 20) {
      s[1] <- 1
    } 
    if(df_temp[Store_Code == j]$dist.km299 < 20) {
      s[2] <- 1
    } 
    if(df_temp[Store_Code == j]$dist.km300 < 20) {
      s[3] <- 1
    } 
    if(df_temp[Store_Code == j]$dist.km301 < 20) {
      s[4] <- 1
    }
  }
  v_temp <- data.frame("Customer_ID" = c(i,i,i,i) , "Store_Code" = c(60298,60299,60300,60301), "Prediction" = s)
  vishal <- rbind.data.frame(vishal,v_temp)
}

dput(head(kk, 5))

structure(list(Customer_ID = 
structure(c(1800000006365760, 1800000006365820,1800000006366060
,1800000006366060,1800000006366060), class = "integer64"), Store_Code = 
c(60067, 60054, 60066, 
60069, 60079), Purchase_2016 = c(2L, 1L, 1L, 1L, 2L), Purchase_2017 = 
c(2L, 
0L, 0L, 0L, 0L), TotalPurchases = c(4L, 1L, 1L, 1L, 2L), Return_2016 = 
c(0L, 
0L, 0L, 0L, 0L), Return_2017 = c(0L, 0L, 0L, 0L, 0L), Return_2010 = c(0L, 
0L, 0L, 0L, 0L), Rp_Ratio_2016 = c(0, 0, 0, 0, 0), Rp_Ratio_2017 = c(0, 
0, 0, 0, 0), Sales_Per_Day = c(1699.6, 2101.1, 1331.4, 1813.1, 
1193.1), Store_Launch_Date = structure(c(1323820800, 1322006400, 
1338163200, 1311984000, 1385164800), class = c("POSIXct", "POSIXt"
), tzone = "UTC"), Store_Size_Sq_Ft = c(8673.5, 12425.5, 15897.1, 
6698.1, 3699.5), Customer_Count = c(89351, 118444, 79249, 114246, 
54832), Total_Revenue = c(35350868.4, 43702303, 27693164.7, 37712369.7, 
24816886.2), dist.km298 = c(140.24, 123.87, 10.2, 131.96, 128.52
), dist.km299 = c(163.37, 140.2, 79.32, 153.01, 145.03), dist.km300 = 
c(4.09, 
21.05, 126.55, 7.03, 17.41), dist.km301 = c(5.72, 19.04, 125.46, 
5.02, 15.4), Nationality = c("INDIA", "UNITED ARAB EMIRATES", 
"SRI LANKA", "SRI LANKA", "SRI LANKA"), Gender = c("M", "F", 
"M", "M", "M"), Marital_Status = c("Married", "Married", "Married", 
"Married", "Married"), Loyalty_Status = c("Gold", "Silver", "Silver", 
"Silver", "Silver"), Points = c(814L, 212L, 186L, 186L, 186L), 
Age = c(59L, 119L, 59L, 59L, 59L), LastVisit = c(2, 28, 3, 
3, 3), Last_rdm_txn_dt1 = structure(c(17601, 16510, 17196, 
17196, 17196), class = "Date"), Last_accr_txn_dt1 = structure(c(17801, 
17029, 17774, 17774, 17774), class = "Date")), .Names = c("Customer_ID", 
"Store_Code", "Purchase_2016", "Purchase_2017", "TotalPurchases", 
"Return_2016", "Return_2017", "Return_2010", "Rp_Ratio_2016", 
"Rp_Ratio_2017", "Sales_Per_Day", "Store_Launch_Date", 
"Store_Size_Sq_Ft", 
"Customer_Count", "Total_Revenue", "dist.km298", "dist.km299", 
"dist.km300", "dist.km301", "Nationality", "Gender", "Marital_Status", 
"Loyalty_Status", "Points", "Age", "LastVisit", "Last_rdm_txn_dt1", 
"Last_accr_txn_dt1"), sorted = "Customer_ID", class = c("data.table", 
"data.frame"), row.names = c(NA, -5L), .internal.selfref = <pointer: 
0x0000000004810788>)

This is my final output required
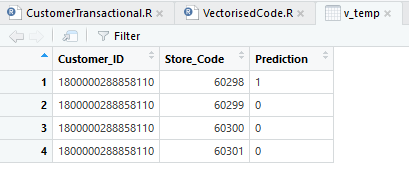
Final%20output%20sample

I'm a little unclear even with your code (which is always a super idea).

R has for and other procedural/imperative constructs for the occasional use when they are convenient. Generally, however, even if that style works, and it's not wrong, it more often than not is the hard way to get where you want to go.

So, if I'm not mangling your objective, you want to know which stores that each of your customers are going to and, if so, whether a new store is within 20km.

I'm going to wave a magic wand and assume we've gotten your data into a tibble with two columns: Customer_id, list_of_stores and another with each store as one column, and a list of new_stores within 20km as the other. I'm going to call the first cust and the second new_stores

> cust
# A tibble:103,103 x 2
# Groups:   Customer_ID, list_of_stores
  Customer_ID list_of_storers
   <int>              <num>
 1  180000623  60067, 60066, 60233
 2  180000627  ... etc
 3  180000723
 4  180000025
 5  179998336
 6  190003328
 7  180007834
 8  180000233
 9  180000134
10  100001344

The best structure for a store distance object is an sf point object, simply its coordinates in a data frame, the store identifier and whether it is "new" this period. You'd have a tribble with each store having a column and roll and filled with its current status as new or non-new and it points coordinates . From that you can create each period a filter with new stores and distance from not-new store, using on of the simple features functions for calculating distance. Let's call this tibble store

Now create a list of stores with new stores within 20 km

invasion <- store %>% filter(new = TRUE & dist <= 20)

Now you want to see if your customers shop at stores that are included in the invasion tibble

exposed <- cust %>% filter(intersect(store_list, invasion))

BIG WARNING: This is a sketch, probably full of syntax and possibly logic. Take it as handwaving only.

It reduces to:

  1. What new shops this period?
  2. Add new_id, new_status, new_sf_points_geometry
  3. Use to create old_store x new_store distance < 20km object
  4. Look at each customer's stores, any within 3. above?
  5. If no, keep going
  6. If yes mutate new column for customer with list of competing stores opened this period and flag the customer as a 1 for possible switch in shopping pattern.

All of this is vectorized under the hood for you courtesy of the tidyverse

2 Likes

Might it be quicker to start with the stores and create a table of all the new stores that are within 20 km of other stores? Then you'd only need to join that to your list of customers + stores. The existing logic seems like it would be rerunning a lot of calculations (distances between stores) that are the same regardless of customer.

1 Like

Can you help me with sample code. I am not able to understand your approach.

Let's start off with the base case, which is a data frame with 10 stores as columns and rows with the distances between them (can be made up) inserted. The another data frame with one column with cust_id and one with a list of stores ["a","b","c","d"] all of which are in the other table. Can you do that mock-up?

1 Like

With the sample data that you have given,

#kk$Customer_ID


new_kk <- kk[,c(1,16,17,18,19)]

library(tidyverse)

new_kk %>% 
  mutate(`60298` = ifelse(dist.km298 <= 20, 1, 0),
         `60299` = ifelse(dist.km299 <= 20, 1, 0),
         `60300` = ifelse(dist.km300 <= 20, 1, 0),
         `60301` = ifelse(dist.km301 <= 20, 1, 0)) %>% 
  gather("stores","prediction", `60298`:`60301`) %>% 
  select(one_of('Customer_ID','stores','prediction'))

Output


        Customer_ID stores prediction
1  1800000006365760  60298          0
2  1800000006365820  60298          0
3  1800000006366060  60298          1
4  1800000006366060  60298          0
5  1800000006366060  60298          0
6  1800000006365760  60299          0
7  1800000006365820  60299          0
8  1800000006366060  60299          0
9  1800000006366060  60299          0
10 1800000006366060  60299          0
11 1800000006365760  60300          1
12 1800000006365820  60300          0
13 1800000006366060  60300          0
14 1800000006366060  60300          1
15 1800000006366060  60300          1
16 1800000006365760  60301          1
17 1800000006365820  60301          1
18 1800000006366060  60301          0
19 1800000006366060  60301          1
20 1800000006366060  60301          1
1 Like

This topic was automatically closed 21 days after the last reply. New replies are no longer allowed.