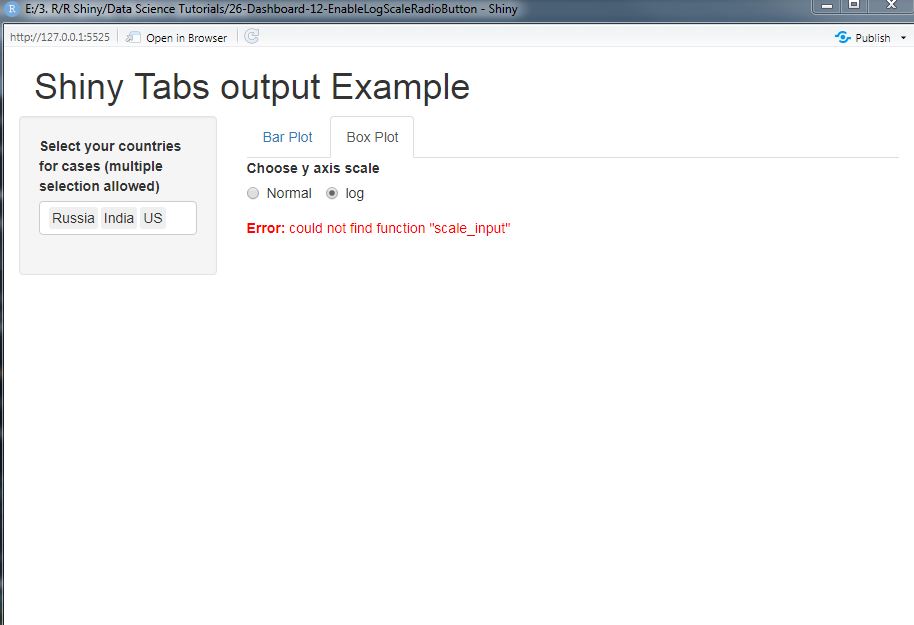
I am trying to give user an option to either transform the y axis variable in log scale or not to transform. This is what I have tried so far and its not working
UI
ui <- fluidPage(
    headerPanel(title = "Shiny Tabs output Example"),
    sidebarLayout(

      sidebarPanel( width = 3,
        selectInput("country_id", "Select your countries for cases (multiple selection allowed)",
                    choices = unique(covid_df$Country_Region), multiple = T,
                    selected = c("India","Russia","US"))

                  ),

      mainPanel( width = 9,
        tabsetPanel(type = "tab",
          tabPanel("Box Plot",
                   radioButtons("scale_input", label = "Choose y axis scale",
                                choices = c("Normal" = "",
                                            "log" = "lnorm"), inline = T),

                   plotOutput("boxplot_id")

                )
              )
  )
)
Server
server <- function(input, output) {

  filter_react <- reactive({

    gather_df %>%
      filter(Country_Region %in% input$country_id)

  })

  output$boxplot_id <- renderPlot({

    scale_input <- switch(input$scale_input,
                          norm = "",
                          lnorm = "scale_y_continuous(trans = 'log2')"
                          )

    filter_react() %>%

      ggplot(aes(x = Country_Region, y = scale_input(Cases_Count), colour = Country_Region)) + #  fill = c("maroon","red","blue","orange")
      # scale_y_continuous(trans = "log2") +
      geom_point(alpha = 0.3, position = "jitter") +
      geom_boxplot(alpha = 0, colour = "black") + #
      facet_wrap(~Case_Type) +
      theme_classic() +
      theme(axis.text.y = element_text(size = 11)) +
      labs(y="log of Cases Count", title = "Box Plot Comparison of Countries Cases according to Types" ) +
      scale_input()
  })

}
Issue
I am getting errors on both buttons and don't know how to resolve.