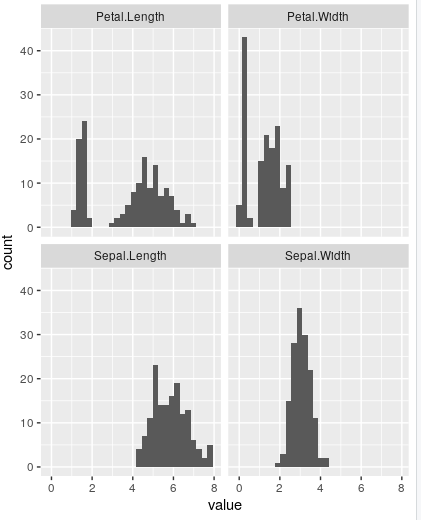
Something like this?
library(tidyverse)

iris2 <- iris %>%
  select(-Species) %>%
  pivot_longer(everything(), names_to = "indicator", values_to = "value")

ggplot(iris2, aes(value)) +
  geom_histogram() +
  facet_wrap(~indicator)