Hi, folks
I want to take two variables from a data frame and uses them to filter rows of interest and write the title of my graph.
I filtered my data frame by year == 2017 and by type == "A". When I wrote my labs(), I tried: labs(title = paste0("Year: ", year), but it failed.
I wanted to have a final plot whose title was the year, in this case, 2017. Is it possible?
library(dplyr)
#>
#> Attaching package: 'dplyr'
#> The following objects are masked from 'package:stats':
#>
#> filter, lag
#> The following objects are masked from 'package:base':
#>
#> intersect, setdiff, setequal, union
library(ggplot2)
# Generate fake data ---------------------------------------------------------------------
set.seed(125)
df = data.frame(
year = c(rep(2017, 3), rep(2018, 3), rep(2019, 3)),
type = rep(c("A", "B", "C"), 3),
month = rep(c("Jan", "Feb", "Mar"), 3),
signal = round(c(runif(3,0,100), runif(3,1000,2000), runif(3,15000,20000)))
) %>%
mutate(month = factor(month, levels = c("Jan", "Feb", "Mar")))
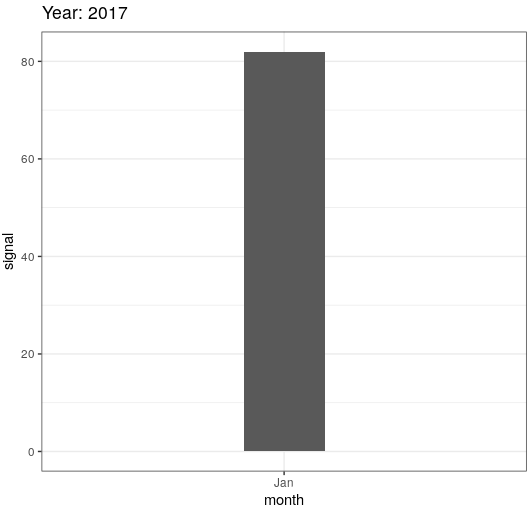
# Plotting the graph I wanted my function to generate ------------------------------------
df %>%
filter(year == 2017, type == "A" ) %>%
ggplot(aes(x = month, y = signal)) +
geom_col(width = .2) +
labs(title = paste0('Year: ', year)) +
theme_bw()
#> Error in paste0("Year: ", year): object 'year' not found
Created on 2021-02-18 by the reprex package (v1.0.0)