Hi, how to interpret this plot regarding arrows ? What does it mean when arrow is pointing left or right ?
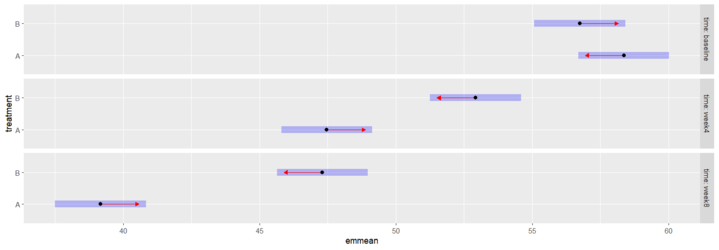
I'm pretty sure this plot was created with the emmeans package, and these are comparison arrows. From the help:
comparisons
Logical value. If TRUE, “comparison arrows” are added to the plot, in such a way that the degree to which arrows overlap reflects as much as possible the significance of the comparison of the two estimates. (A warning is issued if this can't be done.) Note that comparison arrows are not available withsummary_emmobjects.
There are more explanations in the Comparisons vignette and the Explanation supplement.
Thank you, I must read it.
This topic was automatically closed 90 days after the last reply. New replies are no longer allowed.
If you have a query related to it or one of the replies, start a new topic and refer back with a link.