Hi to all
I am a beginner to R Studio and i am really enjoying learning the coding.
i have a simple question, i have a data file with only 2 variables. and I want only to plot data until a certain value.
Like i want to truncate the data to the maximum value of one of the variable .
maybe the word truncated is not the correct word, but i want to create a new set of data, when variable x is a maximum.
Hi Sofia, welcome!, is better if you make your questions with a REPRoducible EXample (reprex) but here is an example with some built-in data
library(dplyr)
library(ggplot2)
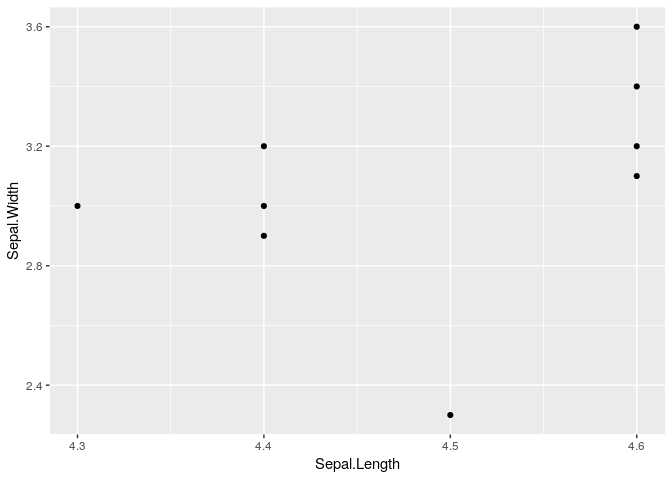
sample_data <- iris[,c("Sepal.Width", "Sepal.Length")]
sample_data %>%
filter(Sepal.Length <= 4.6) %>% # Filtering up to a maximum value
ggplot(aes(Sepal.Length, Sepal.Width)) + # Ploting the result
geom_point()