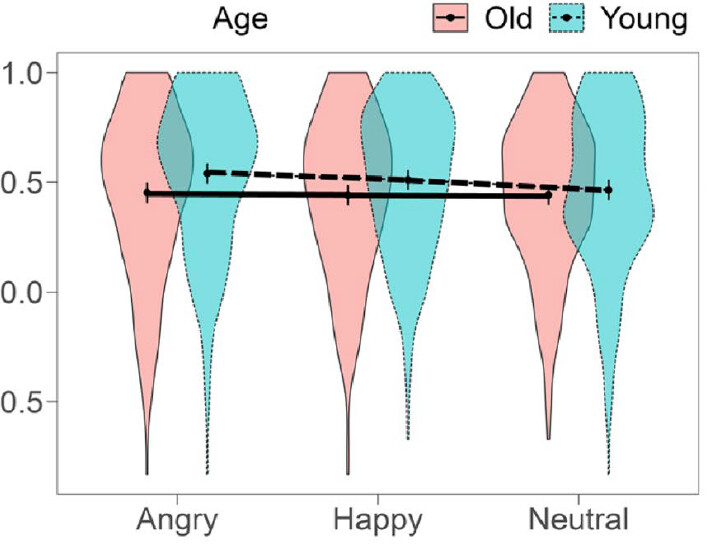
Hi! I'm quite new to R and ggplot, hence the question. I have already computed a violin plot with the variables of interest (Emotion x Accuracy), however I want the plot to be divided by another variable (group) so that the result is somewhat similar to this (see image) but I have no idea how to.
What I have written is this:
data_wide <- GC[,4:6]
data_wide %>%
gather(key="Emotion", value="Accuracy", ) %>%
ggplot( aes(x=Emotion, y=Accuracy, fill=Emotion)) +
geom_violin()
-then there are other scripts related to aesthetics which are not the main issue-.
If you wan to to reproduce this plot in easy form, you need have the same data order. Check the data order in data_wide , check the columns, because if you have the same order columns should run well.