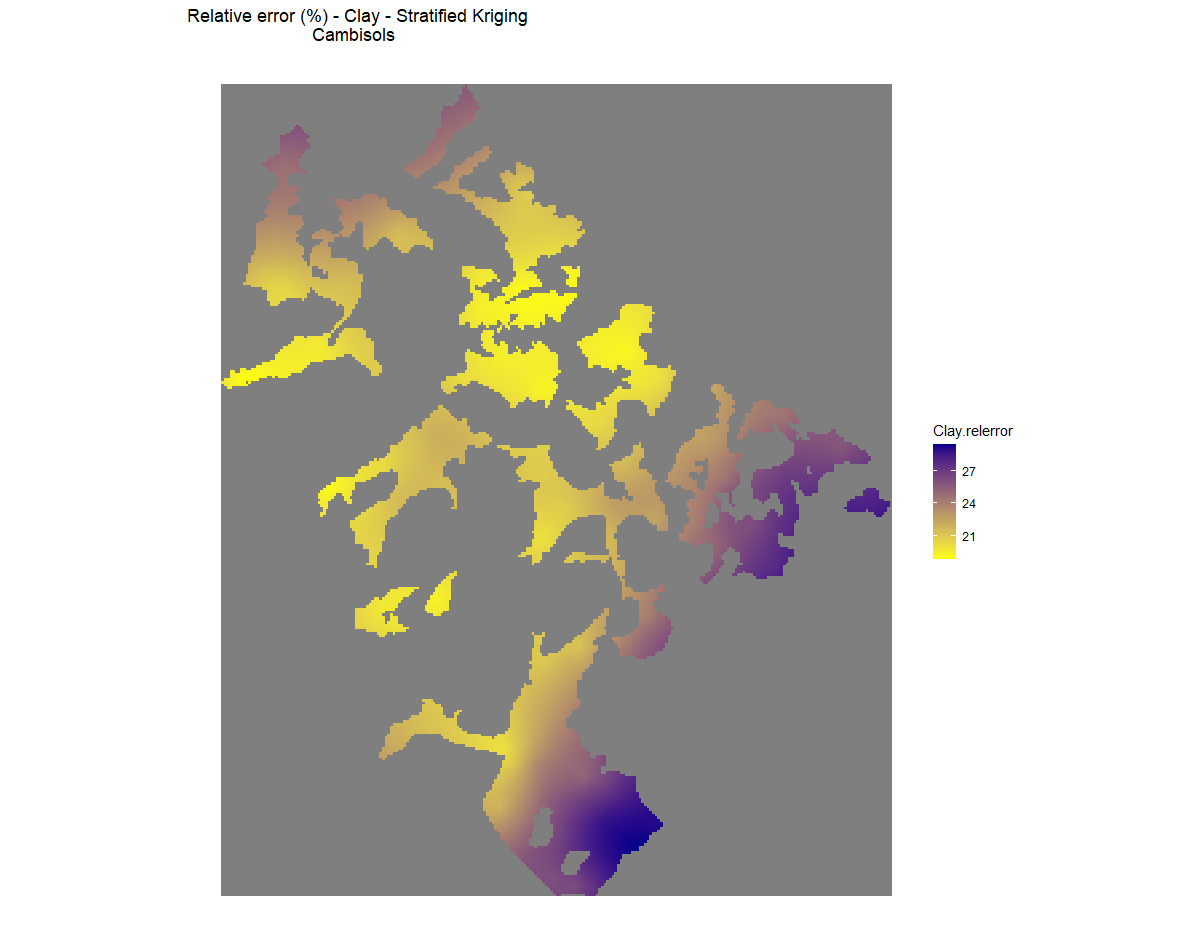
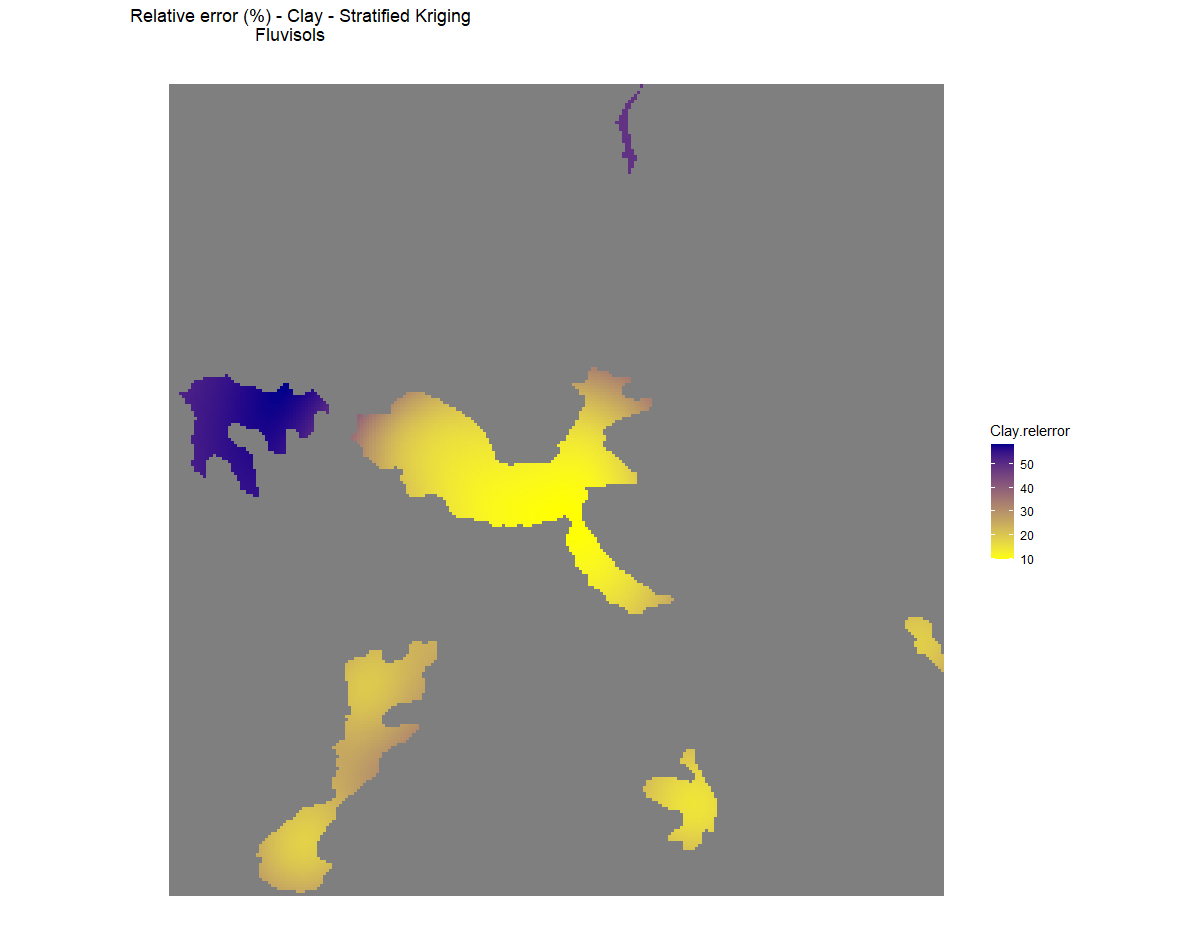
If I have plotted the Relative Error Maps for the Silt soil attribute for the following 4 different soil types: Cambisols, calcisols, leptosols and fluvisols that form my study case area:
I have followed this procedure also for the other 2 soil types i ve got inmy sptudy area (Calcisols, Fluvisols), and i want to combine these 3 maps in one, so as to show the relative error for the soil attribute in total (so as not to have any spaces in the whole area). Is it possible to merge these 3 ggplots in one so as to plot the holistic relative error map for clay?
Hello,
I'm sure you shared this image with the best intentions, but perhaps you didnt realise what it implies.
If someone wished to use example data to test code against, they would type it out from your screenshot...
This is very unlikely to happen, and so it reduces the likelihood you will receive the help you desire.
Therefore please see this guide on how to reprex data. Key to this is use of either datapasta, or dput() to share your data as code