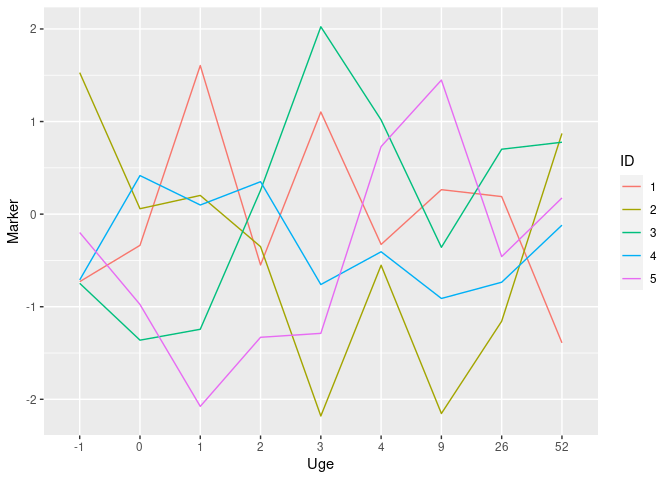
I think you want to use a discrete scale instead of a continuos one, see this example with made up date
library(tidyverse)

# Made up sample data in a copy/paste friendly format
RC <- data.frame(
    ID = rep(1:5, each = 9),
    Uge = rep(c(-1, 0, 1, 2, 3, 4, 9, 26, 52), 5),
    Marker = rnorm(45)
)

RC %>%
    mutate(Uge = as_factor(Uge),
           ID = as_factor(ID)) %>%
    ggplot(aes(x = Uge, y = Marker, group = ID, color = ID)) +
    geom_line()
Created on 2022-01-04 by the reprex package (v2.0.1)
If you need more specific help, please provide a proper REPRoducible EXample (reprex) illustrating your issue.