How can I ensure the plots in my flexdashboard display at an appropriate resolution?
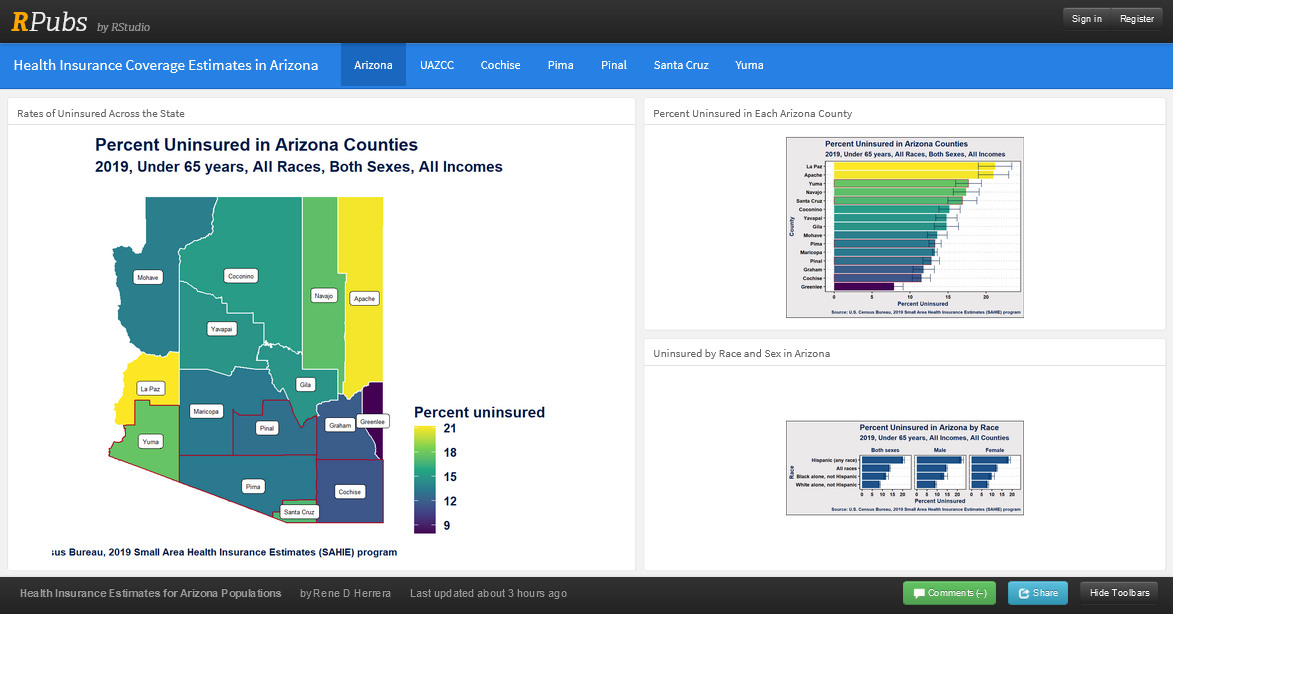
In general, I struggle with getting the output to display at the size and resolution I desire. In this case, I am producing a dashboard. On my large-display widescreen monitor I think it looks okay. But, on my laptop screen I cannot read the text in the plots. What is it that I do not understand about ggplot and/or flexdashboard that is causing this?