Hello @yang6,
So this fuction hist_boxplot is very peculiar. I was hoping we can pass it to an assignment and then just round the values. It turned out not to work.
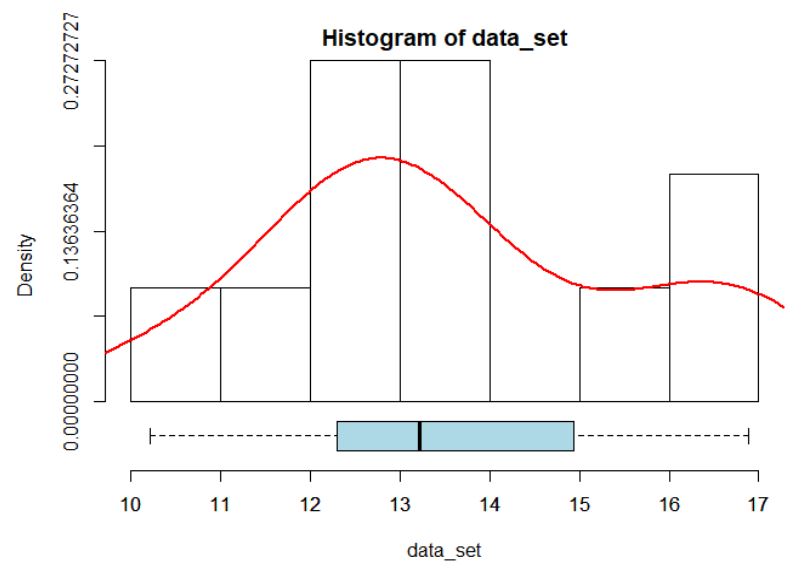
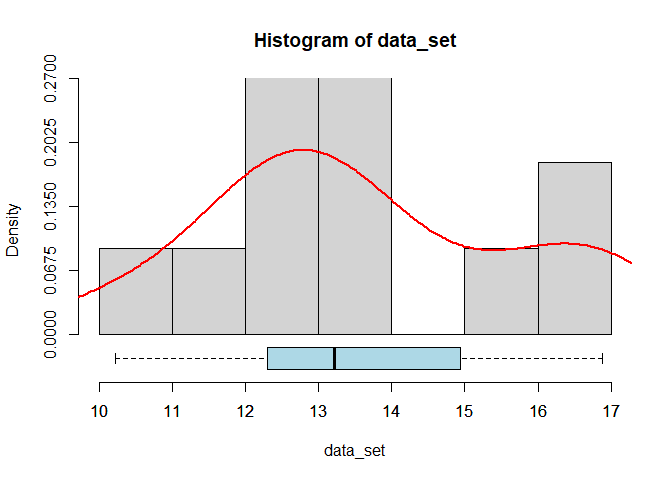
You'll see that I opened up the hist_boxplot function, created my own and applied rounding on certain parts. You can essentially adjust the rounding in the plot function like I did and then run it. See the result below 
options(scipen=999)

data_set <- c(12.05, 10.22, 11.99, 13.22, 13.99, 12.55, 15.88, 16.88, 13.55, 16.77, 12.66)
library(survival)
library(packHV)
library(tidyverse)


custom_hist_boxplot <-
function (x, freq = TRUE, density = FALSE, main = NULL, xlab = NULL,
          ymax = NULL, ...)
{
  abs <- deparse(substitute(x))
  if (is.null(xlab)) {
    xlab = abs
  }
  ted <- hist(x, plot = FALSE)
  par(yaxs = "i")
  if (freq) {
    ylim = c(-(max(ted$counts)/5), max(ted$counts)) %>% round(2)
    boxwex = max(ted$counts)/6
  }
  else {
    if (density) {
      max = max(max(density(x)$y), max(ted$density)) %>% round(2)
    }
    else {
      max = max(ted$density) %>% round(2)
    }
    ylim = c(-max/5, max) %>% round(2)
    boxwex = max/6 %>% round(2)
  }
  if (!is.null(ymax))
    ylim <- c(-ymax/5, ymax)
  if (is.null(main)) {
    main = paste("Histogram of", abs)
  }
  hist(x, ylim = ylim, yaxt = "n", xlab = xlab, freq = freq,
       main = main, ...)
  axis(2, at = seq(0, ylim[2], length = 5))
  usrs <- par()$usr
  par(new = TRUE, bty = "n", xaxs = "i", yaxs = "i",
      ann = FALSE)
  boxplot(x, horizontal = TRUE, ylim = usrs[1:2], add = TRUE,
          at = usrs[3]/2, pars = list(boxwex = 5), col = "lightblue",
          boxwex = ylim[2]/6)
  if (density) {
    lines(density(x), lwd = 2, col = "red")
  }
}


custom_hist_boxplot(data_set, freq = FALSE, density = TRUE)
Created on 2020-10-10 by the reprex package (v0.3.0)