library(tidyverse)
library(tidybayes)

df  <- tribble(
  ~group,  ~value,
  "b",   rcauchy(1000, location = 0, scale = 1)
) %>%
  unnest(value)

df
#> # A tibble: 1,000 x 2
#>    group   value
#>    <chr>   <dbl>
#>  1 b     -1.28
#>  2 b      0.0586
#>  3 b      0.0340
#>  4 b      0.0425
#>  5 b      0.153
#>  6 b     -1.07
#>  7 b      0.0992
#>  8 b      0.690
#>  9 b      0.226
#> 10 b      0.0569
#> # ... with 990 more rows
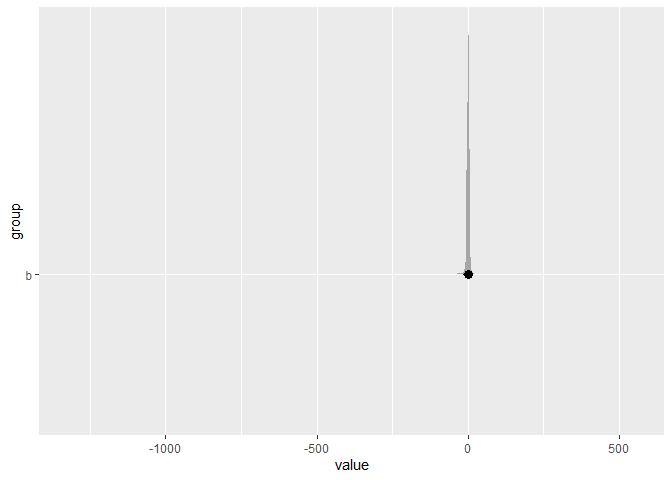
df %>%
  ggplot(aes(x = value,y = group)) +
  stat_halfeyeh()
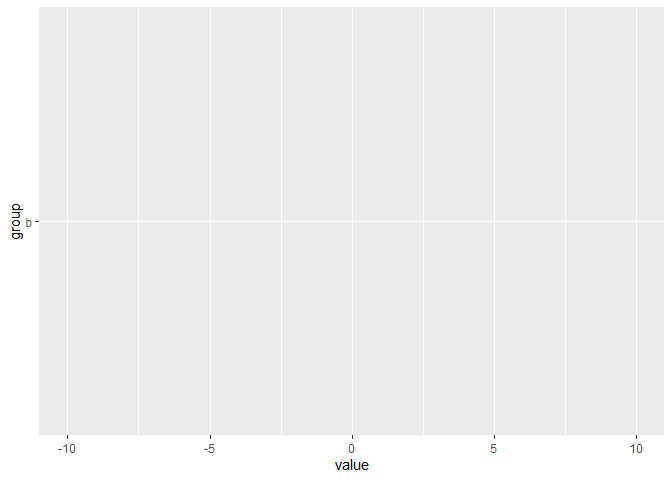
however, the plot is disappeared when set limits for axes.
df %>%
  ggplot(aes(x = value,y = group)) +
  stat_halfeyeh() +
  scale_x_continuous(limits = c(-10, 10))
#> Warning: Computation failed in `stat_sample_slabinterval()`:
#> 'x' contains missing values
Created on 2020-04-26 by the reprex package (v0.3.0)