Hi! I have a question.
When I am using stat_function, there is an option to change colour depending on the geom choose (i.e fill or colour). However, when I plotted one of those, the colour is not what I chose. Is there something wrong with the package?
df <- tibble(x = c(20, 20))
df %>%
ggplot(aes(x = x)) +
xlim(c(0 , 12)) +
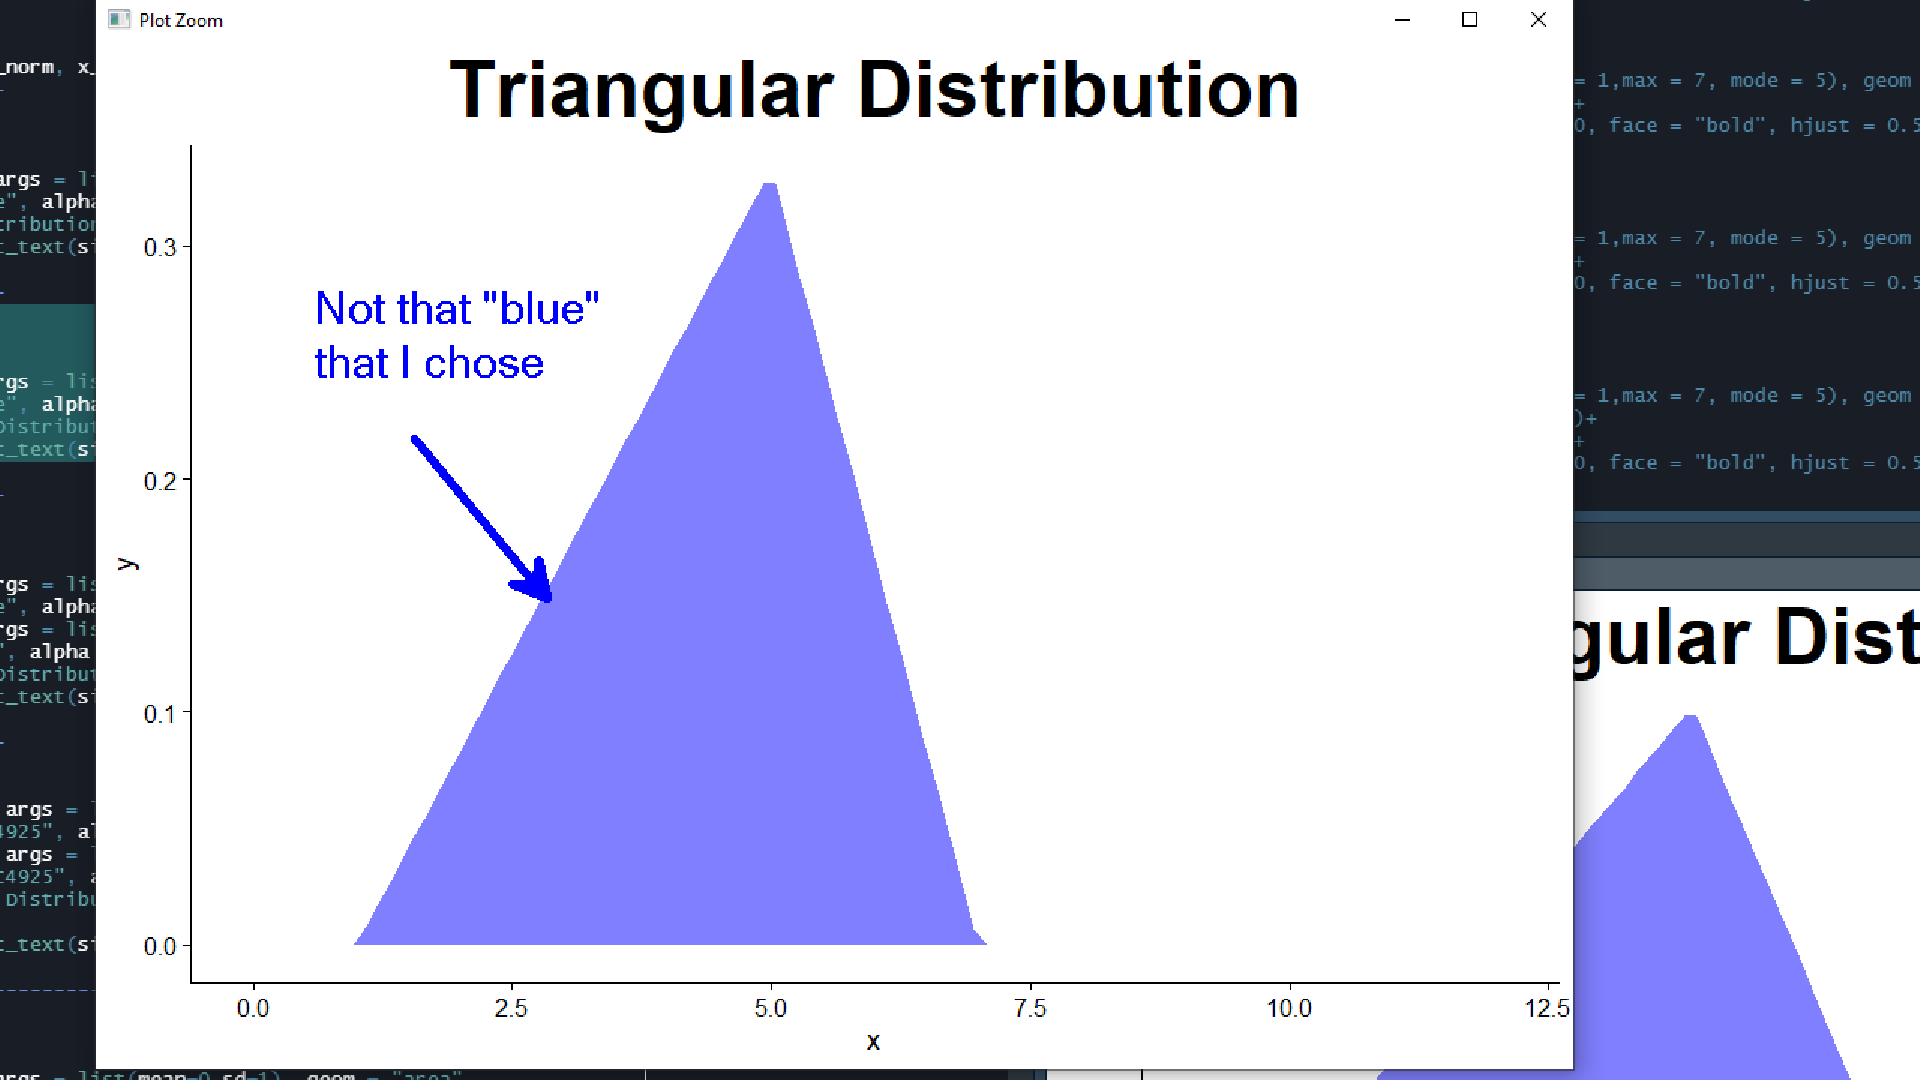
stat_function(fun=dtri, args = list(min = 1,max = 7, mode = 5), geom = "area",
fill = "blue", alpha = 0.5)+
labs(title = 'Triangular Distribution') +
theme(plot.title = element_text(size = 40, face = "bold", hjust = 0.5))
df %>%
ggplot(aes(x = x)) +
xlim(c(0 , 12)) +
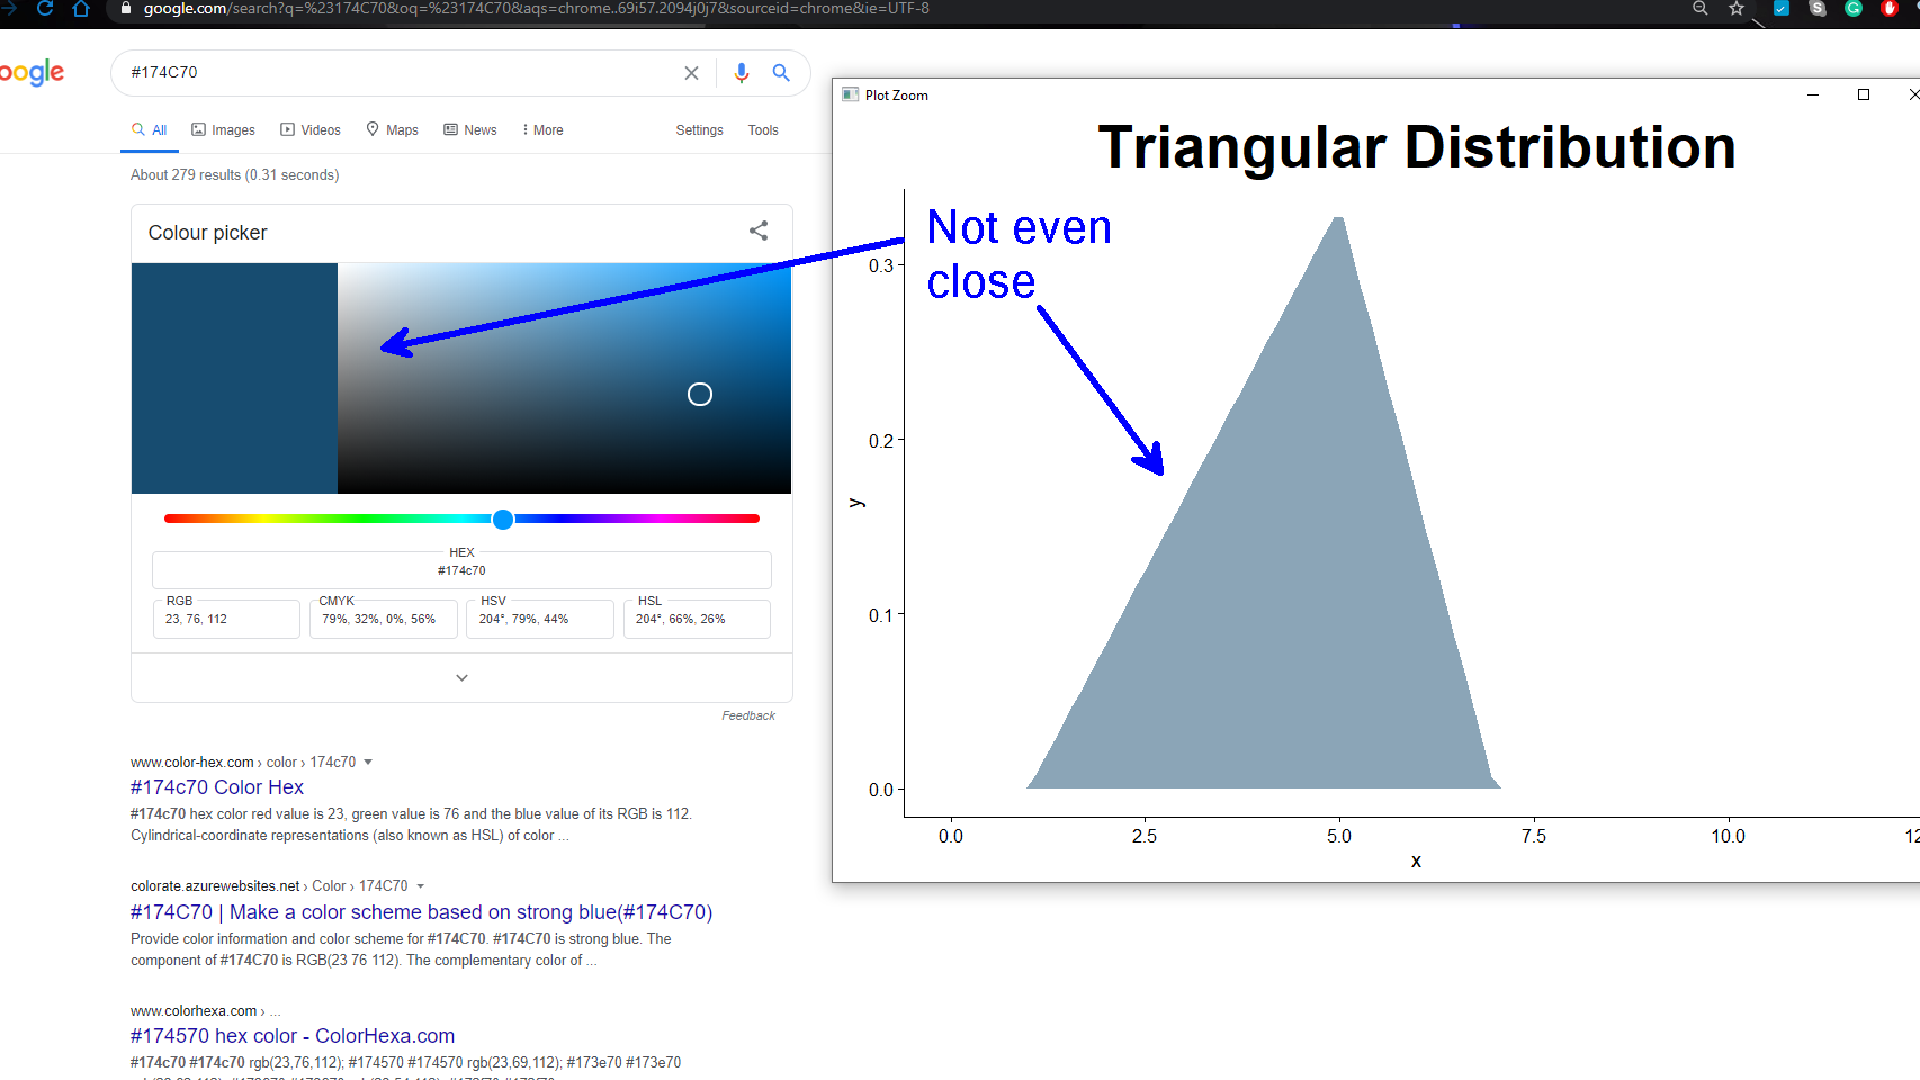
stat_function(fun=dtri, args = list(min = 1,max = 7, mode = 5), geom = "area",
fill = "#174C70", alpha = 0.5)+
labs(title = 'Triangular Distribution') +
theme(plot.title = element_text(size = 40, face = "bold", hjust = 0.5))
I tried to use scale_fill_manual with no results.
Regards