How to select columns from a dataframe in Shiny with PickerInput?

I am trying to create an app where you are able to select the columns that you want to see.

I found this post that it has helped me a lot. Shiny: Connect and display multiple filters with pickerInput and DataTable

However, I don't know how can generate the table only with the columns that I have selected with PickerInput. In the example, you need to filter specific columns, but in my case, I don't have columns to filter, since I want to show in the table that user has selected.

How can I do it?
Because I am sure that the problem is here : datasetInput <- filter(mtcars, colnames(mtcars=input$pick))

The code:


library(shiny)
library(shinyWidgets)

ui <- fluidPage(
    
    # Application title
    titlePanel("Old Faithful Geyser Data"),
    
    # Sidebar with a slider input for number of bins 
    sidebarLayout(
        sidebarPanel(
            uiOutput("picker"),
            actionButton("view", "View Selection")
            
        ),
        
        # Show a plot of the generated distribution
        mainPanel(
            h2('The Mydata'),
            DT::dataTableOutput("table")
            
        )
    )
)

library(shiny)
library(DT)

server <- function(session, input, output) {
    
    data <- reactive({
        mtcars
    })
    
    output$picker <- renderUI({
        pickerInput('pick', 'Choose', choices = colnames(data()), multiple = TRUE)
    })
    
    datasetInput <- eventReactive(input$view,{
        
        datasetInput <- filter(mtcars, colnames(mtcars=input$pick))
        return(datasetInput)
        
    })


    output$table <- renderDT({datasetInput()
    })
}


# Run the application 
shinyApp(ui = ui, server = server)

Thanks in advance

Regards
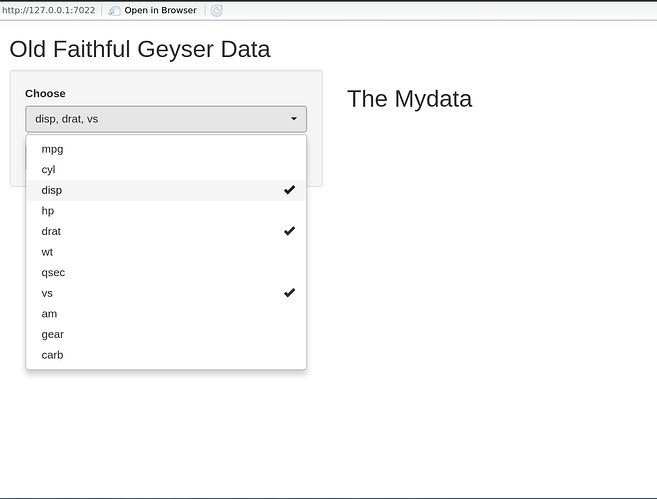
I have found the solution.

Instead of using "filter", it is possible to use "SELECT". Now it works perfectly.

library(shiny)
library(shinyWidgets)
library(dplyr)

ui <- fluidPage(
  
  # Application title
  titlePanel("Old Faithful Geyser Data"),
  
  # Sidebar with a slider input for number of bins 
  sidebarLayout(
    sidebarPanel(
   
      uiOutput("picker"),
      actionButton("view", "View Selection")
      
    ),
    
    # Show a plot of the generated distribution
    mainPanel(
      h2('The Mydata'),
      DT::dataTableOutput("table"),
    )
  )
)

library(shiny)
library(DT)

server <- function(session, input, output) {
  
  data <- reactive({
    mtcars
  })
  
  output$picker <- renderUI({
    pickerInput(inputId = 'pick', 
                label = 'Choose', 
                choices = colnames(data()),
                options = list(`actions-box` = TRUE),multiple = T)
  })
  
  datasetInput <- eventReactive(input$view,{

    datasetInput <- data() %>% 
      select(input$pick)
    
    return(datasetInput)

  })

  output$table <- renderDT({datasetInput()
  })
}


# Run the application 
shinyApp(ui = ui, server = server)

This topic was automatically closed 7 days after the last reply. New replies are no longer allowed.

If you have a query related to it or one of the replies, start a new topic and refer back with a link.