Hello, I'm new to RStudio. I want to see the effects of one coefficient as sample size increases for a linear regression model. Each time, sample size will increase by 5.
I write it like this. The result I get is a horizontal line which is impossible. The coefficient, beta 1, should be consistent as increasing sample size. dat2 is my subset. It seems like my model does not change as sample size increases. I don't where the problem is. Do I get wrong with my_data or my linear model?
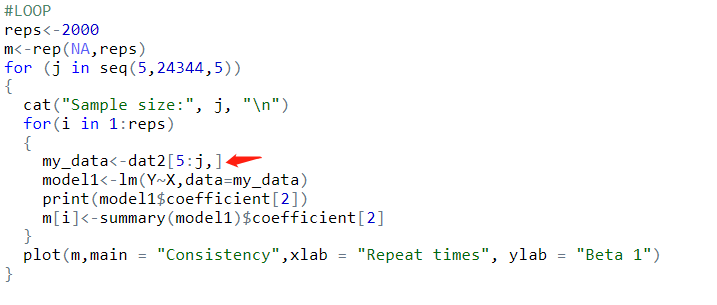
I do not understand the purpose of the inner loop. It fits Y~X using my_data and repeats this 2000 times. The result will be the same every time and all of these values are stored in m. Every individual plot will show a horizontal line.
I would think you would want to make m as long as seq(5, 24344,5), fit the model once for each j and then plot m.
Or am I misunderstanding the code?
This topic was automatically closed 21 days after the last reply. New replies are no longer allowed.
If you have a query related to it or one of the replies, start a new topic and refer back with a link.