Hi ,
I have this table created with formattable package:
tabela_html <- structure(list(Kolumna1 = c("Eclectic_std_res", "p_value", "Biogenic_holm",
"Biogenic_decision", "Medical_std_res", "p_value", "Environmental_holm",
"Environmental_decision", "Psychoanalytic_std_res", "p_value",
"Combination_holm", "Combination_decision"), Biogenic = c("3.0337124588",
"<span style=\"color: red\">0.0024156455</span>", "0.05", "<span style=\"color: red\">Reject</span>",
"2.0356798329", "0.0417821555", "0.025", "No decision", "-4.3605566094",
"<span style=\"color: red\">0.000129732</span>", "0.0166666666666667",
"<span style=\"color: red\">Reject</span>"), Environmental = c("-1.96873182",
"<span style=\"color: red\">0.0489839</span>", "0.05", "<span style=\"color: red\">Reject</span>",
"-0.67675148", "0.49856365", "0.025", "No decision", "2.4655692698",
"<span style=\"color: red\">0.01367868</span>", "0.0166666666666667",
"<span style=\"color: red\">Reject</span>"), Combination = c("-1.86921592",
"0.06159278", "0.05", "No decision", "-1.6275443756", "0.1036721723",
"0.025", "No decision", "2.3778969699", "<span style=\"color: red\">0.0037586677</span>",
"0.0166666666666667", "<span style=\"color: red\">Reject</span>"
)), row.names = c("1", "2", "3", "4", "31", "41", "21", "22",
"5", "6", "32", "33"), class = c("formattable", "data.frame"), formattable = list(
    formatter = "format_table", format = list(), preproc = NULL,
    postproc = NULL))
It looks like this:
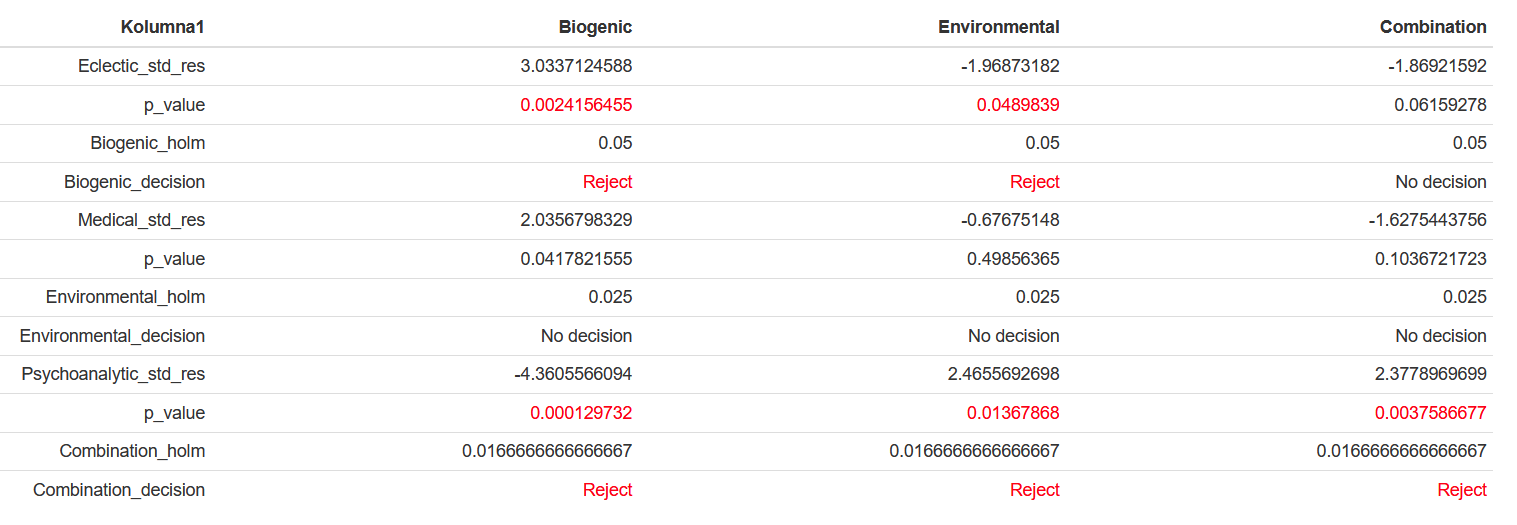
Raw data there is below:
final_data <- structure(list(Kolumna1 = c("Eclectic_std_res", "p_value", "Biogenic_holm",
    "Biogenic_decision", "Medical_std_res", "p_value", "Environmental_holm",
    "Environmental_decision", "Psychoanalytic_std_res", "p_value",
    "Combination_holm", "Combination_decision"), Biogenic = c("3.0337124588",
    "0.0024156455", "0.05", "Reject", "2.0356798329", "0.0417821555",
    "0.025", "No decision", "-4.3605566094", "0.000129732", "0.0166666666666667",
    "Reject"), Environmental = c("-1.96873182", "0.0489839", "0.05",
    "Reject", "-0.67675148", "0.49856365", "0.025", "No decision",
    "2.4655692698", "0.01367868", "0.0166666666666667", "Reject"),
        Combination = c("-1.86921592", "0.06159278", "0.05", "No decision",
        "-1.6275443756", "0.1036721723", "0.025", "No decision",
        "2.3778969699", "0.0037586677", "0.0166666666666667", "Reject"
        )), row.names = c("1", "2", "3", "4", "31", "41", "21", "22",
    "5", "6", "32", "33"), class = "data.frame")
How to save that upper table into proper html file so Excel Power Query will see it ?
How to export this formatted table with red highlighting into Excel preserving that format/colors ?
Or maybe better way exists so final_data can be conditionally formatted into like tabela_html and exported to excel ?