Hi,
I have a pie chart and based on the piece of pie that the user clicks on, i want to filter the next box plot.
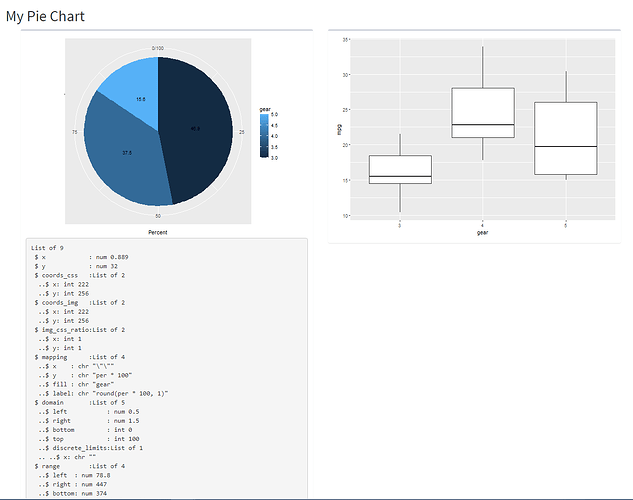
For example, my pie chart shows the number of mtcars with 3,4 and 5 gears. And my boxplot shows the mpg for each gear.
If i click on pie for 3 gears, i want to show only one boxplot, boxplot for gear = 3.
I tried the plot_click function, but i cannot understand how to retrieve the value of gear on which the user clicked. And how to use that criteria to filter the data for the boxplot.
Greatly appreaciate any help. Thanks! My server and ui code are below and a picture of how the shiny looks like.
library(ggplot2)
library(dplyr)
library(shiny)
library(shinyWidgets)
library(shinydashboard)

ui <- fluidPage(

    useShinydashboard(),

    titlePanel("My Pie Chart"),

        mainPanel(
            box(
                plotOutput(outputId = "piePlot", click = "plot_click"),
                verbatimTextOutput("mouse")
                ),
            box(
                plotOutput(outputId = "boxPlot")
        )
    )
)


# Define server logic required to draw pie chart and boxplot
server <- function(input, output) {

# Display pie chart
    output$piePlot <- renderPlot({

        bp <- mtcars %>%
            group_by(gear) %>%
            summarise(count = n()) %>%
            mutate(per=count/sum(count)) %>%
            ungroup %>%
            ggplot(aes(x="", y=per*100, fill=gear,label=round(per*100,1)))+
            geom_bar(width = 1, stat = "identity") + geom_col() +
            geom_text(size = 3, position = position_stack(vjust = 0.5)) +
            ylab("Percent") + xlab("")

        piePlot <- bp + coord_polar("y", start=0)
        return(piePlot)
    })

    #display the return on pie click below the pie
    output$mouse <- renderPrint({
        text <- str(input$plot_click)
        return(text)
    })

# Display the boxplot
    output$boxPlot <- renderPlot({

        mtcars$gear = as.factor(mtcars$gear)
        box <- ggplot(mtcars, aes(x = gear, y = mpg), color = gear)+geom_boxplot()

        return(box)
    })
}

# Run the application
shinyApp(ui = ui, server = server)
