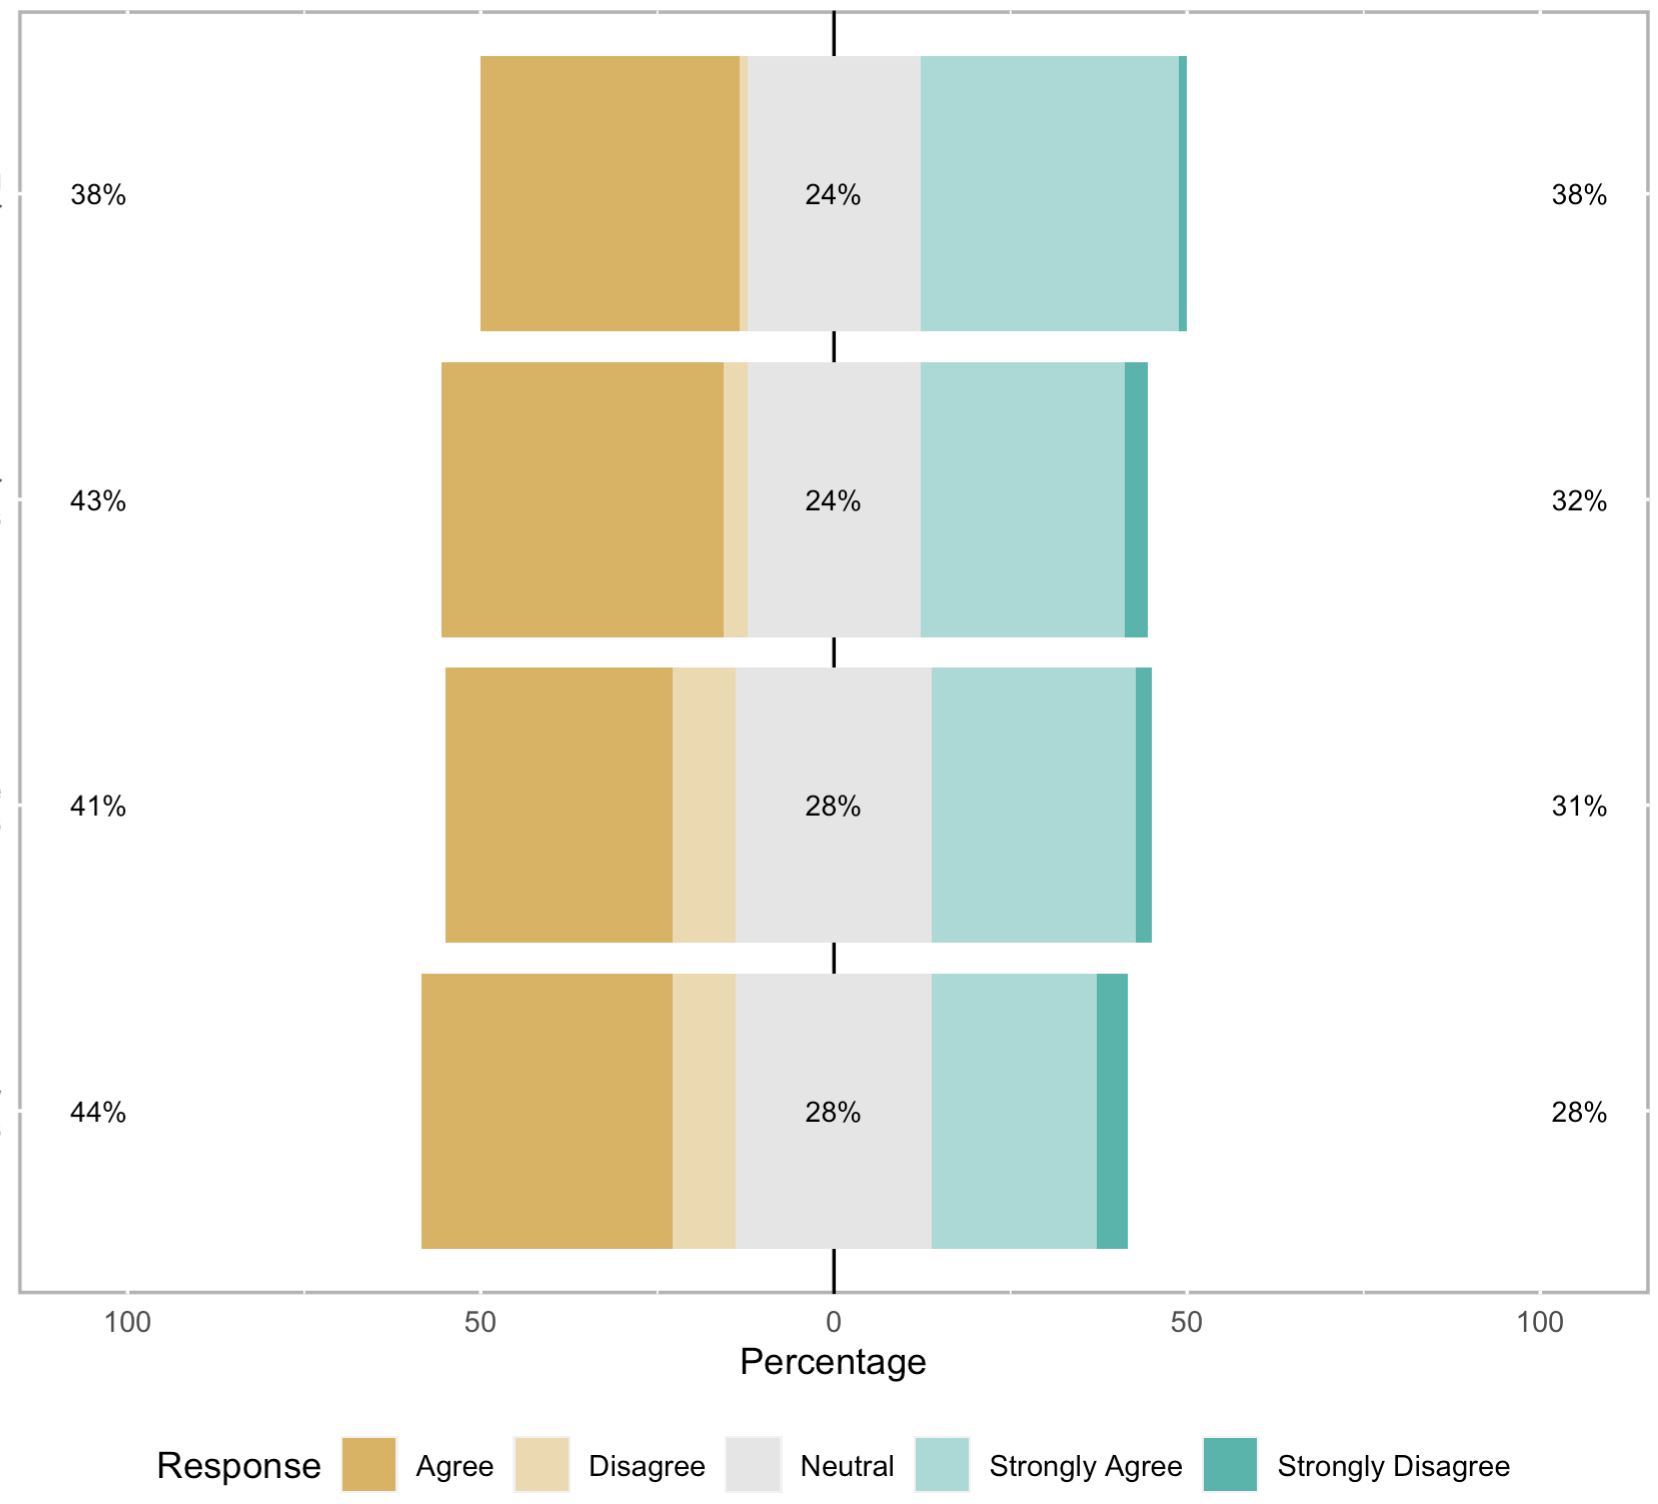
Reading in a csv with 25 columns of Likert-type answers. The range of responses are: "Strongly Disagree","Disagree","Neutral","Agree", "Strongly Agree".
My problem is with the ordering of the responses. It is alphabetic. I want to reorder it so that it matches the sequence above.
I have tried factoring the levels in my created Likert object, hr, using the following before plotting, but it has no effect on the order. Same plot is produced.
Can anyone shed some light on this frustrating problem? What I'm missing? I don't have much more hair to pull out.
Very appreciative of any suggestions.
Thanks everyone.
Kjd
To help us help you, could you please prepare a reproducible example (reprex) illustrating your issue? Please have a look at this guide, to see how to create one:
# Here I run the following to read in my survey data
# itemshr <- read.csv("HR Survery Project - Likert.csv")
library(dplyr)
library(likert)
# Here is a simulation:
itemshr <- data.frame(stringsAsFactors = F,
Q2_1 = c("Strongly agree","Disagree","Neutral","Agree", "Strongly disagree"),
Q2_2 = c("Strongly disagree","Disagree","Neutral","Agree", "Strongly agree"),
Q2_3 = c("Neutral","Disagree","Strongly disagree","Agree", "Strongly agree"))
itemshr1 <- itemshr %>%
mutate_if(is.character, as.factor)
names(itemshr1) <- c(
Q2_1="I like my job",
Q2_2="I feel confident in my job",
Q2_3=" I would recommend my company")
hr <- as.data.frame(itemshr1)
hr <- likert(itemshr1)
# Viewing hr shows the Response order alphabetically
hr
# And here is the Likter plot, showing the same
plot(hr)
#I try to reorder the Response with the following, but it has no affect.
#I place this line after running hr <- likert(itemshr1).
hr$levels <- factor(hr$levels, levels=c("Strongly Disagree","Disagree","Neutral","Agree", "Strongly Agree"),
                  ordered = T)
#No difference to the Response order in the plot.
#I'm trying to place the disagree responses together, then neutral, then the agree responses together.
#But I'm missing something because it doesn't change.
plot(hr)
Probably not the simplest solution, but I just created a function to set the levels in the correct order and applied it to each variable. I did not install the likert package to see if the plot is now correct.
library(dplyr)
#>
#> Attaching package: 'dplyr'
#> The following objects are masked from 'package:stats':
#>
#>     filter, lag
#> The following objects are masked from 'package:base':
#>
#>     intersect, setdiff, setequal, union

# Here is a simulation:
itemshr <- data.frame(stringsAsFactors = F,
                      Q2_1 = c("Strongly agree","Disagree","Neutral","Agree", "Strongly disagree"),
                      Q2_2 = c("Strongly disagree","Disagree","Neutral","Agree", "Strongly agree"),
                      Q2_3 = c("Neutral","Disagree","Strongly disagree","Agree", "Strongly agree"))

factor_likert <- function(x){
  factor(x, levels = c("Strongly disagree", "Disagree", "Neutral", "Agree", "Strongly agree"))
}

itemshr1 <- itemshr %>%
  mutate(across(everything(), factor_likert))

str(itemshr1)
#> 'data.frame':    5 obs. of  3 variables:
#>  $ Q2_1: Factor w/ 5 levels "Strongly disagree",..: 5 2 3 4 1
#>  $ Q2_2: Factor w/ 5 levels "Strongly disagree",..: 1 2 3 4 5
#>  $ Q2_3: Factor w/ 5 levels "Strongly disagree",..: 3 2 1 4 5
Thank you so much for such an expert solution, EconProf. I tried and tried but couldn't see it. Works like a charm. Brilliant. Really appreciate it. KJD.