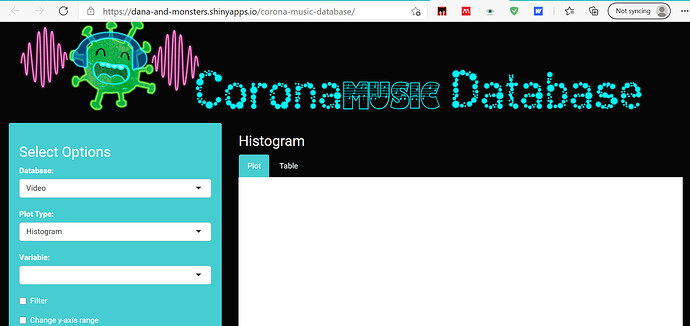
I have built this Shiny app: Coronamusic Database (shinyapps.io)
The full code can be found here and see reprex below: dana-and-monsters/corona-music-database: Shiny web application for visualizing data collected in the corona music database. (github.com)
Before the user selects a variable, there is a white space where the plot will go. My theme is black so I was wondering if anyone knows how to replace the white space with black? By inspecting the app I can see that this is labelled the img but I am not sure how to change the img that is loaded before the plot appears.
Thank you so much!
Minimal Reprex:
library(ggplot2)
library(shiny)
library(dplyr)
library(shinythemes)

# Crate reprex data frame
variable<-as.factor(c(1,0,0,1,0))
count<-c(1,2,3,4,5)

video<-data_frame(variable,count)
## UI

ui<-fluidPage(
  theme = shinytheme("cyborg"),# other options: darkly, slate, cyborg
  # # CSS
  tags$head(
    tags$style(HTML("

        h3 {
        font-size: 26px;
        }
        .well {
         color: white;
         background-color: #45CDD1;
        }
                    "))
  ),


  sidebarLayout(

    ### INPUT

    sidebarPanel = sidebarPanel(


      h3("Select Options"),
      selectInput("plottype","Plot Type:",
                  list("Histogram" = "histogram")
      ),
      selectInput("variableName", "Variable:",
                  NULL
      )
    ),
    ### OUTPUT

    mainPanel = mainPanel(
      tags$style(HTML("
          .nav.nav-tabs>li.active>a{
          background-color: #45CDD1;
          }
                  ")),
      h3(textOutput("caption")),

      ## tabsets

      tabsetPanel(
        type = "tabs",
        tabPanel("Plot",
                 conditionalPanel(
                   condition = 'input.plottype == "histogram"',
                   plotOutput('histogram')
                 )
        )
      )
    ),
    position = c("left", "right"),
    fluid = TRUE
  )
)

## SERVER
server<-function(input, output, session){
  check<-function(x){is.null(x) || x==""}

  ### Update available options in the variable list

  options<-c()

  observe({
    if("histogram" %in% input$plottype){
        options<-c(options,"variable")
      }
    updateSelectInput(session, "variableName", choices = options,selected = input$variableName)
  })


  ### Plot title

  output$caption<-renderText({
    switch(input$plottype,
           "histogram" 	= 	"Histogram"
    )
  })

  ### Get variable name

  variable<-reactive({
    check<-function(x){is.null(x) || x==""}
    if(check(input$variableName)) return() # if no variable name
    var<-input$variableName
    var
  })


  ### Get data object

  plotData<-reactive({
    data=video

    variable<-variable()

    check<-function(x){is.null(x) || x==""}

    if(check(variable)) return()

    check<-function(obj){
      !all(variable %in% colnames(obj))
    }

    if(check(data)) return()

    obj<-list(data = data,
              variable = variable)

    obj

  })

  ## HISTOGRAM

  output$histogram<- renderPlot({
    plot.obj<-plotData()
    #conditions for plotting
    if(is.null(plot.obj)) return()

    #make sure variable and group have loaded
    if(plot.obj$variable == "") return()

    df_long<-plot.obj$data

    df<-df_long%>%
      select(variable, count)%>%
      group_by(variable)%>%
      summarise(count =sum(count, na.rm = TRUE)) # note without the na.rm = TRUE any instances of NA result in NAs for the sum

    names(df)<-c("Variable", "Count")

    ggplot(df,
           aes_string(
             x = "Variable",
             fill = "Variable",
             y = "Count"))+
      geom_col()+
      ggtitle(paste("Histogram of", input$variableName))+
      theme_black()+
      theme(axis.text.x = element_text(angle = 45))
  })

}

# Create Shiny app ----
shinyApp(ui, server, options = list(height = 1000))
