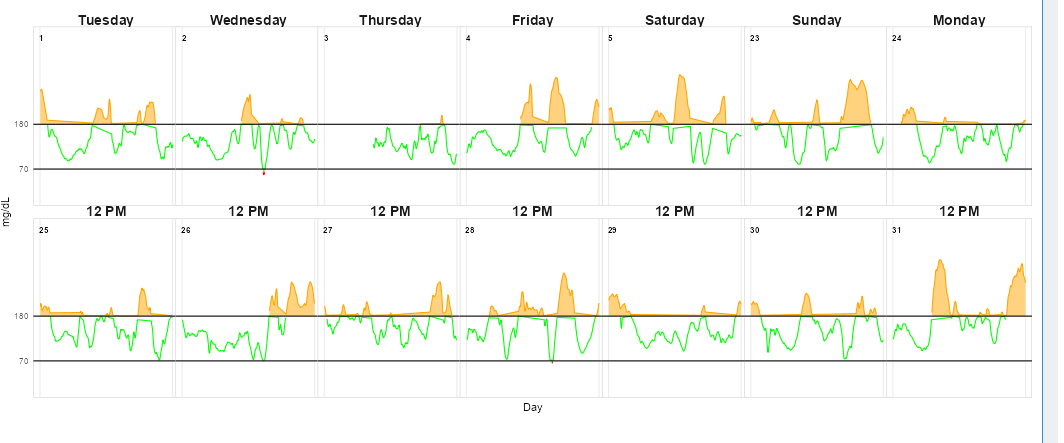
How to remove the start and end column in shiny line graph showing 14 days data representation.Each day graph box have a start and end grid ,i want to remove this grid and start plotting from 0 and make a continuous graph.
output$glucose_plot <- renderPlot({
  p <- ggplot() +
    geom_ribbon(data = data_below_70, aes(x = Date_Time, ymin = 70, ymax = CGM_Value), fill = "red", alpha = 0.5) +
    geom_ribbon(data = data_above_180, aes(x = Date_Time, ymin = 180, ymax = CGM_Value), fill = "orange", alpha = 0.5) +
    geom_line(data = data_between_70_180, aes(x = Date_Time, y = CGM_Value), color = "green") +
    geom_line(data = data_below_70, aes(x = Date_Time, y = CGM_Value), color = "red") +
    geom_line(data = data_above_180, aes(x = Date_Time, y = CGM_Value), color = "orange") +
    geom_hline(yintercept = 180, color = "black", linetype = "solid") +
    geom_hline(yintercept = 70, color = "black", linetype = "solid") +
    labs(x = "Day", y = "mg/dL") +
    #  scale_x_datetime(date_breaks = "1 day", date_labels = "%d") +
     scale_x_datetime(date_breaks = "1 day", date_labels = "%d") +
    #  scale_x_datetime(limits = date_range) +  # Ensure the plot starts and ends at the data range
    scale_y_continuous(breaks = c(70, 180), limits = c(0, 400)) +
    theme_minimal() +
    facet_wrap(~DayNum, ncol = 7, scales = "free_x", labeller = labeller(DayNum = as_labeller(function(day) {
      # paste0( remaining_weekdays_extended, "\n", unique(data[data$DayNum == day, ]$DayNum))
    paste0( remaining_weekdays_extended)
    }))) +

    theme(
      strip.background = element_blank(),  # Remove the background of the strip
      #  strip.background = element_blank(),  # Remove the background of the strip
      # strip.text = element_text(size = 8, face = "bold", margin = margin(t = 0.1, r = 2, b = 0.5, l = 2, unit = "pt")),
      strip.text = element_text(size = 14, face = "bold", margin = margin(t = 0.1, r = 0, b = 0.5, l = 0, unit = "pt")),  # Adjust the top margin
      panel.background = element_rect(fill = "white", color = "grey80"),
      # panel.grid.major = element_blank(),  # Remove major grid lines
      panel.grid.minor = element_blank(),  # Remove minor grid lines
      axis.text.x = element_blank(),  # Remove x-axis text
      axis.ticks.x = element_blank(),  # Remove x-axis ticks
      panel.spacing = unit(-0.25, "lines"),
      plot.margin = margin(t = 0, r = 0, b = 0, l = 0, unit = "pt"),  # Remove space around the plot
      strip.placement = "outside",
     strip.text.y = element_text(margin = margin(t = 100, b = 100, unit = "pt"))  # Reduce space between strip and plot
    )+
     geom_text(data = data %>% distinct(DayNum, Date),
              aes(x = as.POSIXct(paste(Date, "00:00:00")), y = 400, label = DayNum),
              vjust = 1, hjust = 0.1, size = 3, fontface = "bold")


  print(p)
})