How to put letters at the top and center of the error bars

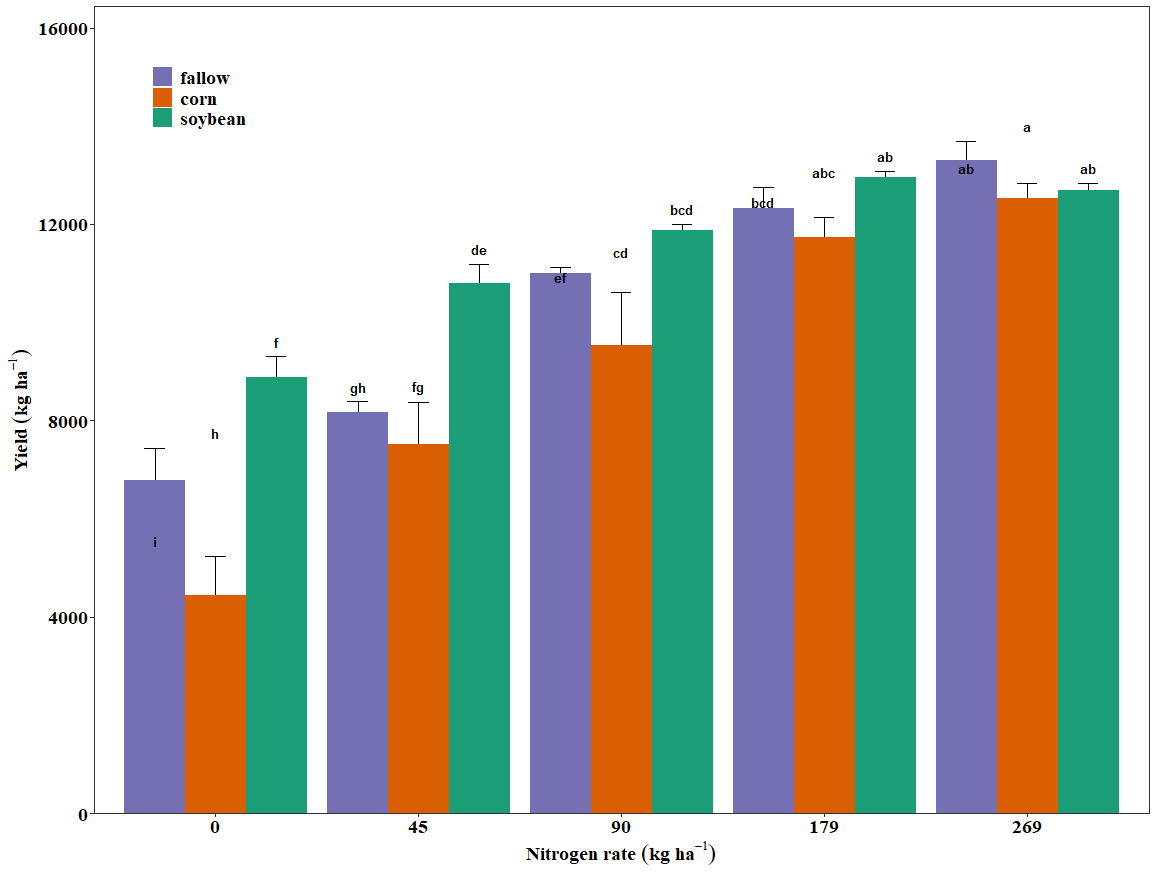
Hi everyone please I can someone help me with this; I need the letters to be at the top of the error bars in this bar plot. Thank you very much.

data

yield <- structure(
  list(
    N_rate = structure(
      c(
        4L,
        5L,
        3L,
        1L,
        2L,
        5L,
        3L,
        4L,
        1L,
        2L,
        1L,
        4L,
        5L,
        2L,
        3L,
        1L,
        2L,
        4L,
        3L,
        5L,
        1L,
        3L,
        2L,
        4L,
        5L,
        3L,
        5L,
        4L,
        2L,
        1L,
        5L,
        1L,
        2L,
        4L,
        3L,
        4L,
        3L,
        1L,
        2L,
        5L,
        2L,
        5L,
        3L,
        1L,
        4L,
        3L,
        5L,
        1L,
        2L,
        4L,
        3L,
        5L,
        1L,
        4L,
        2L,
        2L,
        5L,
        1L,
        4L,
        3L
      ),
      levels = c("0", "45", "90", "179", "269"),
      class = "factor"
    ),
    History = structure(
      c(
        2L,
        2L,
        2L,
        2L,
        2L,
        3L,
        3L,
        3L,
        3L,
        3L,
        1L,
        1L,
        1L,
        1L,
        1L,
        1L,
        1L,
        1L,
        1L,
        1L,
        2L,
        2L,
        2L,
        2L,
        2L,
        3L,
        3L,
        3L,
        3L,
        3L,
        3L,
        3L,
        3L,
        3L,
        3L,
        1L,
        1L,
        1L,
        1L,
        1L,
        2L,
        2L,
        2L,
        2L,
        2L,
        2L,
        2L,
        2L,
        2L,
        2L,
        3L,
        3L,
        3L,
        3L,
        3L,
        1L,
        1L,
        1L,
        1L,
        1L
      ),
      levels = c("fallow", "corn", "soybean"),
      class = "factor"
    ),
    Rep = structure(
      c(
        1L,
        1L,
        1L,
        1L,
        1L,
        1L,
        1L,
        1L,
        1L,
        1L,
        1L,
        1L,
        1L,
        1L,
        1L,
        2L,
        2L,
        2L,
        2L,
        2L,
        2L,
        2L,
        2L,
        2L,
        2L,
        2L,
        2L,
        2L,
        2L,
        2L,
        3L,
        3L,
        3L,
        3L,
        3L,
        3L,
        3L,
        3L,
        3L,
        3L,
        3L,
        3L,
        3L,
        3L,
        3L,
        4L,
        4L,
        4L,
        4L,
        4L,
        4L,
        4L,
        4L,
        4L,
        4L,
        4L,
        4L,
        4L,
        4L,
        4L
      ),
      levels = c("1", "2", "3", "4"),
      class = "factor"
    ),
    `Yield at std moisture (kg/ha)` = c(
      12346.9249590533,
      11860.0460239527,
      6286.35275360947,
      2793.90516411834,
      5127.27805576331,
      12312.7660459172,
      12086.4480249941,
      12772.9435023905,
      7781.93368615385,
      10711.1602139645,
      7813.41363351479,
      12249.8439422485,
      13803.4656340828,
      7778.30574504142,
      11177.9322092308,
      4926.47739379882,
      7942.4952744142,
      11233.1764305799,
      10579.7313287574,
      12547.0432825562,
      3660.44141822485,
      10565.0201115266,
      7381.04619323077,
      10584.2536581302,
      12692.5976236686,
      11582.7898622485,
      12617.2233679527,
      13225.3150068639,
      11339.0543647811,
      9553.99606381065,
      12957.7648473373,
      8697.03144369231,
      9722.50007176331,
      12775.756836355,
      12011.991252071,
      13313.2421907692,
      11158.0877072663,
      7208.26549775148,
      8189.39052383432,
      14138.8465351953,
      8795.41415233136,
      13314.8147184852,
      10684.0892228166,
      6489.22772449704,
      12286.5138609231,
      10587.1551712189,
      12207.7824999763,
      4808.05912842604,
      8768.34316118343,
      11741.9321865089,
      11842.0952736568,
      12872.0694350769,
      9509.94219323077,
      13085.1710848757,
      11423.857488284,
      8773.69689372781,
      12733.0655431953,
      7236.61298669823,
      12536.2749318817,
      11056.5389481657
    )
  ),
  row.names = c(NA, -60L),
  class = c("tbl_df", "tbl", "data.frame")
)

Convert character to factor

yield$History <- factor(yield$History,levels = c('fallow','corn','soybean'))
yield$N_rate <- factor(yield$N_rate)
yield$Rep <- factor(yield$Rep)

Fit a linear model

mod_plot <- lm(Yield at std moisture (kg/ha)~Rep+History*N_rate,data=yield)

Letters <- agricolae::LSD.test(y = mod_plot,trt = c('N_rate','History'),console = T,group = T)

LSD_table <- Letters$groups  # Extracts means and groups

Add proper column names for interaction terms

LSD_table <- LSD_table %>%
  tibble::rownames_to_column(var = "Interaction_Term") %>%  # Convert row names to a column
  tidyr::separate(Interaction_Term, into = c("N_rate", "History"), sep = ":", fill = "right")

Print formatted table

print(LSD_table)

First, calculate summary stats (mean and SE)

summary_data <- yield %>%
  group_by(N_rate, History) %>%
  summarise(
    mean = mean(`Yield at std moisture (kg/ha)`, na.rm = TRUE),
    se = sd(`Yield at std moisture (kg/ha)`, na.rm = TRUE) / sqrt(n()),
    .groups = "drop"
  )

Merge with LSD table for labels

label_data <- summary_data %>%
  left_join(LSD_table, by = c("N_rate", "History")) %>%
  mutate(label_y = mean + se)  # place label at center of error bar top

Final plot

p1 <- ggplot(data = yield, aes(x = N_rate, y = `Yield at std moisture (kg/ha)`, fill = History)) +
  # Error bars
  stat_summary(
    geom = 'errorbar',
    position = position_dodge(.9),
    width = .3,
    fun.data = 'mean_se', col = 'black'
  ) +
  # Bars
  stat_summary(
    geom = 'col',
    position = position_dodge(.9),
    fun = mean
  ) +
  scale_fill_brewer(palette = 'Dark2') +
  scale_y_continuous(expand = expansion(mult = c(0, 0.2), add = c(0, 0.4))) +
  ylab(expression(bold(Yield ~ (kg ~ ha ^ -1)))) +
  xlab(expression(bold(Nitrogen ~rate ~ (kg ~ ha ^ -1)))) +
  scale_fill_manual(name = '', values = c('#7570B3','#D95F02','#1B9E77')) +
  # Text labels exactly at the top of error bars
  geom_text(
    data = label_data,
    aes(
      x = N_rate,
      y = label_y,
      label = groups,
      fill = History
    ),
    position = position_dodge(.9),
    show.legend = FALSE,
    vjust = -0.9,
    fontface='bold'
  ) +
  theme_test() +
  theme(
    legend.position = c(0.1, 0.9),
    axis.title  = element_text(
      family = 'serif',
      face = 'bold',
      colour = 'black',
      size = 16
    ),
    axis.text = element_text(
      family = 'serif',
      face = 'bold',
      colour = 'black',
      size = 16
    ),
    legend.text = element_text(
      family = 'serif',
      face = 'bold',
      colour = 'black',
      size = 16
    )
  )

p1

You’re almost there—the misalignment comes from using different dodge/group settings across layers (bars, error bars, and text). The fix is to (1) compute the summary yourself, (2) use one shared position_dodge() object everywhere, and (3) map the same grouping (group = History) for error bars and text so they dodge identically to the bars.

Below is a clean, reproducible solution that places the letters exactly at the top-center of each error bar.

Key fixes

  • Wrap your response variable in backticks in the model:
    lm(Yield at std moisture (kg/ha) ~ Rep + History * N_rate, data = yield)

Use one position object for all layers:
pos <- position_dodge(width = 0.9)

Compute summaries once; then use geom_col(), geom_errorbar(), and geom_text() all with the same pos and grouping.

library(dplyr)
library(ggplot2)
library(tidyr)
library(agricolae)

--- Model (fix backticks) ---

mod_plot <- lm(Yield at std moisture (kg/ha) ~ Rep + History * N_rate, data = yield)

--- Letters from LSD.test (interaction groups) ---

Letters <- agricolae::LSD.test(y = mod_plot, trt = c("N_rate","History"),
console = TRUE, group = TRUE)

LSD_table <- Letters$groups %>%
tibble::rownames_to_column(var = "Interaction_Term") %>%
tidyr::separate(Interaction_Term, into = c("N_rate","History"), sep = ":", fill = "right")

--- Summary stats (mean and SE) ---

summary_data <- yield %>%
group_by(N_rate, History) %>%
summarise(
mean = mean(Yield at std moisture (kg/ha), na.rm = TRUE),
se = sd(Yield at std moisture (kg/ha), na.rm = TRUE) / sqrt(n()),
.groups = "drop"
)

--- Merge letters and compute label y-position (top of error bar) ---

label_data <- summary_data %>%
left_join(LSD_table, by = c("N_rate","History")) %>%
mutate(y_label = mean + se)

--- One shared dodge for all layers ---

pos <- position_dodge(width = 0.9)

--- Plot: bars, error bars, centered letters at the top of error bars ---

p1 <- ggplot(summary_data,
aes(x = N_rate, y = mean, fill = History, group = History)) +

Bars from precomputed means (width slightly < dodge width looks nice)

geom_col(position = pos, width = 0.8) +

Error bars using the same dodge & grouping

geom_errorbar(aes(ymin = mean - se, ymax = mean + se),
position = pos, width = 0.3, color = "black") +

Letters exactly on top of the error bars (same dodge + group)

geom_text(data = label_data,
aes(y = y_label, label = groups, group = History),
position = pos,
vjust = -0.25, # small lift above the cap; use vjust = 0.5 to sit on the cap
fontface = "bold",
show.legend = FALSE) +

Scales & labels (pick either brewer OR manual, not both)

scale_fill_brewer(palette = "Dark2", name = "") +
scale_y_continuous(
expand = expansion(mult = c(0, 0.08)) # leave room for letters
) +
ylab(expression(bold(Yield ~ (kg ~ ha^-1)))) +
xlab(expression(bold(Nitrogen ~ rate ~ (kg ~ ha^-1)))) +
theme_test(base_size = 14) +
theme(
legend.position = c(0.1, 0.9),
axis.title = element_text(family = "serif", face = "bold", colour = "black"),
axis.text = element_text(family = "serif", face = "bold", colour = "black"),
legend.text = element_text(family = "serif", face = "bold", colour = "black")
)

p1

Notes

  • Exact centering on the top cap: The text is horizontally centered by the dodge; if you want the text to sit right on the cap, set vjust = 0.5. If you want it slightly above, use a small negative value like -0.2 to -0.4.
  • Remove either scale_fill_brewer() or scale_fill_manual()—using both can cause conflicts. I kept scale_fill_brewer() only.
  • Because we precomputed mean and se, we use geom_col()/geom_errorbar() instead of stat_summary()—this avoids any stat/dodge inconsistencies.

If you prefer to keep stat_summary(), the same principle applies: create pos <- position_dodge(0.9), use it in every layer, and set group = History on layers that don’t use fill directly.


More R plotting patterns and tidyverse recipes at rprogrammingbooks.com — quick guides, reproducible snippets, and end-to-end tutorials.

@rprogrammingbooks thank you very much for the help, I am looking for a way to put all the letters at the top of the error bars.