Okay so I am doing a pheatmap, but I am unable to put "+" as an upper subscript on "Li" in my plot.
This is the code I used:
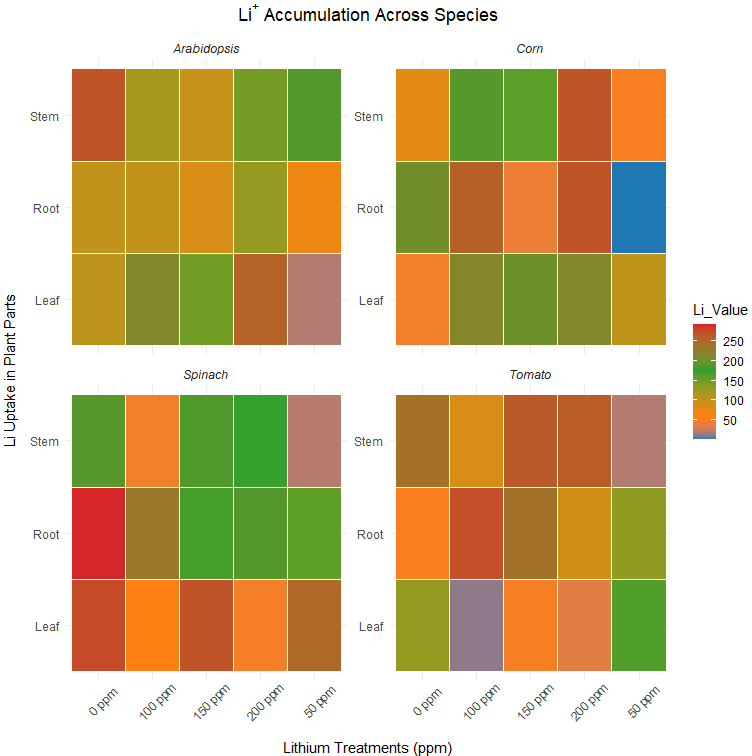
ggplot(data_long, aes(x = Treatment, y = Li_Part, fill = Li_Value)) +
geom_tile(color = "white", linewidth = 0.5) +
scale_fill_gradient(low = "white", high = "blue") +
facet_wrap(~ Species, scales = "free_y", ncol = 2) +
labs(title = "Li Accumulation Across Species",
x = "Lithium Treatments (ppm)",
y = "Li Uptake in Plant Parts") +
theme_minimal() +
scale_fill_gradientn(colours = c("#1f77b4", "#ff7f0e", "#2ca02c", "#d62728"),
values = c(0, 0.1, 0.4, 0.7, 1),
breaks = c(0, 50, 100, 150, 200, 250, 300),
labels = c("0", "50", "100", "150", "200", "250", "300")) +
theme(axis.text.x = element_text(angle = 45, margin = margin(t = 10)),
axis.title.x = element_text(margin = margin(r = 10)),
axis.title.y = element_text(margin = margin(r = 10)),
legend.position = 'right',
plot.title = element_text(hjust = 0.5)) +
theme(text = element_text(family = "Times New Roman"),
strip.text = element_text(face = "italic"))
I tried to get help from Meta AI.. and the code Meta AI was giving me is not working:
This is the code Metal AI gave me:
levels = c("Li_in_Leaves", "Li_in_Shoot", "Li_in_Root"),
labels = c(expression(Li^"+"~"in Leaves"),
expression(Li^"+"~"in Shoot"),
expression(Li^"+"~"in Root")))
When I used this code, the labels in the plot were changed into exactly these symbols and letters.