How to print summary statistics of one variable by multiple variables in columns into one table.

Hello,

i have dataset like this:

dat <- data.frame(
  value = c(1.0,0.9,0.8,0.6,0.3,0.0,0.5,0.6,0.8,0.9,0.5,0.4),
  var1 = c(1,0,1,0,0,0,1,0,0,1,1,1),
  var2 = c(0,1,0,1,0,0,0,1,1,1,1,0),
  var3 = c(0,1,1,1,0,1,1,1,1,1,1,0)
)

Before, I converted all the original categorical variables to binary variables (var1-var50) in the first step, because I think I can somehow move forward with such a dataset.

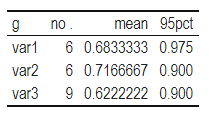
Now, I have many variables in columns (more than 50) and I would like to calculate descriptive statistics for the variable "value" for every categorical variable in place (number of observations, mean, 95pct, etc.). In other words, if the categorical (now binary) variable is = 1. Something like this:

          no.   mean   95pct
var 1     x       x           x
var 2     x       x           x
var 3     x       x           x

Thus, i would like to have variables in rows and descriptive statistics of variable "value" in columns (number of observations, mean, 95pct.) if the particular variable varx appplies.

I suppose I will have to use some for function (some loop) and then bind the results into one table. I would then ideally like to save such a table and perhaps put it into a document using the stargazer package (or something like this).

Thanks
Jan

library(tidyverse)

dat <- data.frame(
  value = c(1.0,0.9,0.8,0.6,0.3,0.0,0.5,0.6,0.8,0.9,0.5,0.4),
  var1 = c(1,0,1,0,0,0,1,0,0,1,1,1),
  var2 = c(0,1,0,1,0,0,0,1,1,1,1,0),
  var3 = c(0,1,1,1,0,1,1,1,1,1,1,0)
)


s1 <- do.call(cbind, lapply(dat, summary))
s2 <- t(s1)

Output

> s2
      Min. 1st Qu. Median      Mean 3rd Qu. Max.
value    0   0.475    0.6 0.6083333   0.825    1
var1     0   0.000    0.5 0.5000000   1.000    1
var2     0   0.000    0.5 0.5000000   1.000    1
var3     0   0.750    1.0 0.7500000   1.000    1

EDIT:
If you need to export it you can use kableExtra

library(kableExtra)
s2 %>% 
  kbl() %>% 
  kable_classic(full_width = F) 

Then copy and paste the output in Word. Or you can export as png adding %>% save_kable("name.png", zoom = 10)

Here is Flm's approach adapted to a tidyverse sort of approach, the functions are manually chosen rather than being the defaults from summary.

library(kableExtra)

dat <- data.frame(
  value = c(1.0, 0.9, 0.8, 0.6, 0.3, 0.0, 0.5, 0.6, 0.8, 0.9, 0.5, 0.4),
  var1 = c(1, 0, 1, 0, 0, 0, 1, 0, 0, 1, 1, 1),
  var2 = c(0, 1, 0, 1, 0, 0, 0, 1, 1, 1, 1, 0),
  var3 = c(0, 1, 1, 1, 0, 1, 1, 1, 1, 1, 1, 0)
)
result_df <- map_dfr(
  paste0("var", 1:3),
  ~ {
    dat %>%
      mutate(g = .x) %>%
      filter(!!sym(.x) == 1) %>%
      group_by_at("g") %>%
      summarise(across(
        .cols = "value",
        .fns = list(
          `no .` = length,
          mean = mean,
          `95pct` = function(x) {
            quantile(
              x = x,
              probs = .95
            )
          }
        ),
        .names = "{.fn}"
      ))
  }
)

result_df %>%
  kbl() %>%
  kable_classic(full_width = F)

image

1 Like

Thanks, it works great!

This topic was automatically closed 7 days after the last reply. New replies are no longer allowed.

If you have a query related to it or one of the replies, start a new topic and refer back with a link.