How to print alternative text instead of "Error: undefined columns selected"

Hope this reprex is 'minimal' enough! I really tried to pare it down as much as possible...

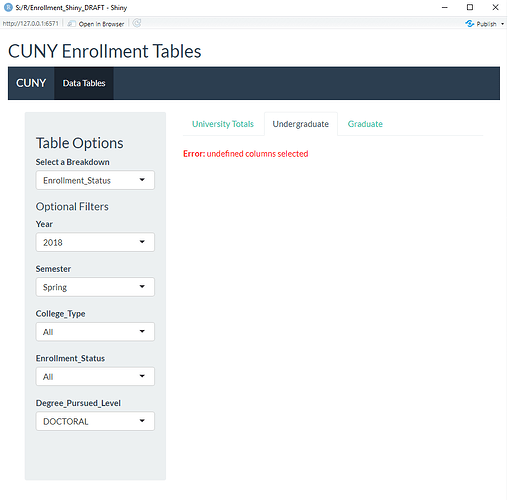
My shiny app below works great! No problems except if the user selects options that filter out ALL of the data (i.e. selecting an undergraduate degree but viewing the graduate tab) the table shows an error. "Error: undefined columns selected"

I am trying to figure out the best way to handle this. My thought is that the best way is to show a message that says something like, "No data matches your filters" instead of trying to code different menus for each tab and each possible scenario, but I can't for the life of me figure out how to do this. I swear I have tried searching google, stack overflow, and RStudio Community and can't seem to get anything to work!

Any feedback on my code and best practices is also appreciated. I am pretty new to all this and there's probably more efficient ways of doing this...

###############  LOAD PACKAGES #################################################

library(shiny)
library(shinythemes)
library(dplyr)
library(tidyr)
library(DT)

###############  LOAD DATA  ####################################################

df <- structure(list(Year = c(rep(2017L, 93), rep(2018L, 90)),
                    Semester = c(rep("Fall", 45), rep("Spring", 48),
                                 rep("Fall", 44), rep("Spring", 46)),
                    College_Type = c(rep("Community", 18), rep("Senior", 27),
                                    rep("Community", 18), rep("Senior", 30),
                                    rep("Community", 18), rep("Senior", 26),
                                    rep("Community", 18), rep("Senior", 28)),
                    College = c(rep("BMCC", 6), rep("Bronx", 6), rep("Hostos", 6),
                                rep("Baruch", 9), rep("Staten Island", 12), rep("York", 6),
                                rep("BMCC", 6), rep("Bronx", 6), rep("Hostos", 6),
                                rep("Baruch", 10), rep("Staten Island", 13),
                                rep("York", 7), rep("BMCC", 6), rep("Bronx", 6), rep("Hostos", 6),
                                rep("Baruch", 8), rep("Staten Island", 12), rep("York", 6),
                                rep("BMCC", 6), rep("Bronx", 6), rep("Hostos", 6), rep("Baruch", 9),
                                rep("Staten Island", 13), rep("York", 6)),
                    Class_Level = c(rep("UNDERGRADUATE", 18), rep("GRADUATE", 5),
                                    rep("UNDERGRADUATE", 4), rep("GRADUATE", 6),
                                    rep("UNDERGRADUATE", 6), rep("GRADUATE", 2),
                                    rep("UNDERGRADUATE", 22), rep("GRADUATE", 6),
                                    rep("UNDERGRADUATE", 4), rep("GRADUATE", 6),
                                    rep("UNDERGRADUATE", 7), rep("GRADUATE", 3),
                                    rep("UNDERGRADUATE", 22), rep("GRADUATE", 4),
                                    rep("UNDERGRADUATE", 4), rep("GRADUATE", 6),
                                    rep("UNDERGRADUATE", 6), rep("GRADUATE", 2),
                                    rep("UNDERGRADUATE", 22), rep("GRADUATE", 5),
                                    rep("UNDERGRADUATE", 4), rep("GRADUATE", 7),
                                    rep("UNDERGRADUATE", 6), rep("GRADUATE", 2),
                                    rep("UNDERGRADUATE", 4)),
                    Enrollment_Status = c(rep(c(rep("FULL-TIME",3),rep("PART-TIME",3)),3),
                                          rep("FULL-TIME",2), rep("PART-TIME",3),
                                          rep("FULL-TIME",2), rep("PART-TIME",2),
                                          rep("FULL-TIME",2), rep("PART-TIME",4),
                                          rep("FULL-TIME",3), rep("PART-TIME",3),
                                          "FULL-TIME", "PART-TIME", rep("FULL-TIME",2),
                                          "PART-TIME", "PART-TIME",
                                          rep(c(rep("FULL-TIME",3),rep("PART-TIME",3)),4),
                                          rep("FULL-TIME",2), rep("PART-TIME",2),
                                          rep("FULL-TIME",2), rep("PART-TIME",4),
                                          rep("FULL-TIME",4), rep("PART-TIME",3),
                                          "FULL-TIME",  rep("PART-TIME",2),
                                          rep("FULL-TIME",2), rep("PART-TIME",2),
                                          rep(c(rep("FULL-TIME",3),rep("PART-TIME",3)),3),
                                          rep(c(rep("FULL-TIME",2),rep("PART-TIME",2)),3),
                                          rep("PART-TIME",2), "FULL-TIME",
                                          rep("FULL-TIME",2), rep("PART-TIME",3),
                                          "FULL-TIME", "PART-TIME",
                                          rep("FULL-TIME",2), rep("PART-TIME",2),
                                          rep(c(rep("FULL-TIME",3),rep("PART-TIME",3)),3),
                                          rep("FULL-TIME",2), rep("PART-TIME",3),
                                          rep("FULL-TIME",2), rep("PART-TIME",2),
                                          rep("FULL-TIME",3), rep("PART-TIME",4),
                                          rep("FULL-TIME",3), rep("PART-TIME",3),
                                          "FULL-TIME", "PART-TIME",
                                          rep("FULL-TIME",2), rep("PART-TIME",2)),
                    Degree_Pursued_Level = c(rep(c("ASSOCIATE", "CERTIFICATE", "NONDEGREE"),6),
                                             "MASTER'S", "NONDEGREE", "ADVANCED CERTIFICATE",
                                             "MASTER'S", "NONDEGREE", rep(c("BACHELOR'S", "NONDEGREE"),2),
                                             "DOCTORAL", "MASTER'S", "ADVANCED CERTIFICATE",
                                             "DOCTORAL", "MASTER'S", "NONDEGREE",
                                             rep(c("ASSOCIATE", "BACHELOR'S", "NONDEGREE"),2),
                                             rep("MASTER'S",2), rep(c("BACHELOR'S", "NONDEGREE"),2),
                                             rep(c("ASSOCIATE", "CERTIFICATE", "NONDEGREE"),6),
                                             rep(c("ADVANCED CERTIFICATE", "MASTER'S", "NONDEGREE"),2),
                                             rep(c("BACHELOR'S", "NONDEGREE"),2),
                                             "DOCTORAL", "MASTER'S", "ADVANCED CERTIFICATE",
                                             "DOCTORAL", "MASTER'S", "NONDEGREE",
                                             "ASSOCIATE", "BACHELOR'S", "CERTIFICATE", "NONDEGREE",
                                             "ASSOCIATE", "BACHELOR'S", "NONDEGREE",
                                             rep("MASTER'S",2), "NONDEGREE",
                                             rep(c("BACHELOR'S", "NONDEGREE"),2),
                                             rep(c("ASSOCIATE", "CERTIFICATE", "NONDEGREE"),6),
                                             rep(c("MASTER'S", "NONDEGREE"),2),
                                             rep(c("BACHELOR'S", "NONDEGREE"),2),
                                             "DOCTORAL", "MASTER'S", "ADVANCED CERTIFICATE",
                                             "DOCTORAL", "MASTER'S", "NONDEGREE",
                                             rep(c("ASSOCIATE", "BACHELOR'S", "NONDEGREE"),2),
                                             rep("MASTER'S",2), rep(c("BACHELOR'S", "NONDEGREE"),2),
                                             rep(c("ASSOCIATE", "CERTIFICATE", "NONDEGREE"),6),
                                             "MASTER'S", "NONDEGREE", "ADVANCED CERTIFICATE", "MASTER'S",
                                             "NONDEGREE", rep(c("BACHELOR'S", "NONDEGREE"),2),
                                             rep(c("ADVANCED CERTIFICATE", "DOCTORAL", "MASTER'S"),2),
                                             "NONDEGREE", rep(c("ASSOCIATE", "BACHELOR'S", "NONDEGREE"),2),
                                             rep("MASTER'S",2), rep(c("BACHELOR'S", "NONDEGREE"),2)),
                    SUM.HST.HEADCOUNT. = c(18404,
                             4, 71, 7017, 32, 1404, 7087, 57, 2, 2935, 91, 763, 4073, 19,
                             73, 2385, 63, 598, 615, 18, 19, 2372, 12, 11541, 57, 3362, 293,
                             59, 142, 62, 3, 674, 145, 4125, 5571, 14, 1129, 1293, 377, 126,
                             14, 4976, 80, 2082, 1255, 16621, 5, 54, 7234, 33, 1405, 6443,
                             49, 3, 3227, 97, 1001, 3784, 26, 45, 2358, 65, 701, 3, 577, 3,
                             51, 2322, 6, 10760, 38, 3859, 326, 41, 107, 45, 19, 645, 129,
                             3311, 5170, 1, 7, 1190, 1600, 360, 56, 37, 0, 4366, 52, 2239,
                             1260, 18011, 5, 60, 7014, 33, 1383, 6637, 44, 4, 2778, 74, 982,
                             4041, 22, 75, 2441, 59, 693, 527, 39, 2433, 6, 11442, 53, 3187,
                             342, 60, 166, 59, 7, 629, 115, 3978, 5566, 23, 1003, 1268, 373,
                             147, 51, 5003, 82, 2123, 1287, 16510, 4, 69, 6614, 35, 1604,
                             6395, 42, 5, 2976, 93, 965, 3842, 22, 41, 2324, 55, 604, 606,
                             4, 3, 2308, 11, 11051, 71, 3610, 357, 1, 39, 133, 41, 30, 653,
                             120, 3525, 5141, 11, 1117, 1341, 376, 54, 75, 4627, 59, 2075,
                             1215)),
                    row.names = c(NA, -183L), class = "data.frame")

###############  DATA CLEANING AND PREP  #######################################

# Create Sorted Lists for dropdown menus
college <- df[, c("College")] %>% unique() %>% sort() %>% append("All")
year <- df[, c("Year")] %>% unique() %>% sort()
semester <- df[, c("Semester")] %>% unique() %>% sort()
college_type <- df[, c("College_Type")] %>% unique() %>% sort() %>% append("All")
class_level <- df[, c("Class_Level")] %>% unique() %>% sort() %>% append("All")
enrollment_status <- df[, c('Enrollment_Status')] %>% unique() %>% sort() %>% append("All")
degree_pursued <- df[, c('Degree_Pursued_Level')] %>% unique() %>% sort() %>% append("All")

breakdown_options <- names(df)[c(6,7)]

###############  USER INTERFACE  ###############################################

ui <- fluidPage(
    #themeSelector(),
    theme = shinytheme("flatly"),
    titlePanel('CUNY Enrollment Tables'),

    navbarPage("CUNY",

# <<<<<<<<<<<<<<<<<<<<<<<  Enrollment Tables  >>>>>>>>>>>>>>>>>>>>>>>>>>>>>>>>>>

        tabPanel("Data Tables",
            sidebarPanel(
                h3('Table Options'),
                selectInput('breakdown', 'Select a Breakdown',
                            breakdown_options, selected='Degree_Status'),
                h4('Optional Filters'),
                selectInput('year', 'Year',
                            year, selected=max(year)),
                selectInput('semester', 'Semester',
                            semester, selected='Spring'),
                selectInput('college_type', 'College_Type',
                            college_type, selected='All'),
                selectInput('enrollment_status', 'Enrollment_Status',
                            enrollment_status, selected='All'),
                selectInput('degree_pursued', 'Degree_Pursued_Level',
                            degree_pursued, selected='All'),
                hr(),
                br()
            ),
            mainPanel(
                tabsetPanel(
                    tabPanel('University Totals',
                        br(),
                        dataTableOutput('university_table1')
                    ),
                    tabPanel('Undergraduate',
                        br(),
                        dataTableOutput('undergrad_table1')
                    ),
                    tabPanel('Graduate',
                        br(),
                        dataTableOutput('graduate_table1')
                    ),
                    id='DataTab'
                )
            )
        )

    )
)

###############  SERVER  #######################################################

server <- function(input, output) {

# <<<<<<<<<<<<<<<<<<<<<<<  Reactive Data Prep  >>>>>>>>>>>>>>>>>>>>>>>>>>>>>>>>>

# <<<<<<<<  Set up selections for "All" vs selected values in filters  >>>>>>>>>

    college_type_select <- reactive(
        if (input$college_type == "All") {
            head(college_type, n=-1)
            } else {input$college_type})

    enrollment_status_select <- reactive(
        if (input$enrollment_status == "All") {
            head(enrollment_status, n=-1)
            } else {input$enrollment_status})

    degree_pursued_select <- reactive(
        if (input$degree_pursued == "All") {
            head(degree_pursued, n=-1)
            } else {input$degree_pursued})


# <<<<<<<<<<<<  Filter out unnecessary rows for Data Tables Tab >>>>>>>>>>>>>>>>

    selection1 <- reactive({
        df %>%
            filter( Year==input$year &
                    Semester==input$semester &
                    College_Type %in% college_type_select() &
                    Enrollment_Status %in% enrollment_status_select() &
                    Degree_Pursued_Level %in% degree_pursued_select())
    })

    university_data1 <- reactive({
        selection1() %>%
            group_by(College, .data[[input$breakdown]]) %>%
            summarise(Total=sum(SUM.HST.HEADCOUNT., na.rm=TRUE)) %>%
            spread(.data[[input$breakdown]], Total, fill=0) %>%
            as.data.frame() %>%
            mutate(TOTAL = rowSums(.[3:ncol(.)], na.rm=TRUE))
    })

    undergrad_data1 <- reactive({
        selection1() %>%
            filter( Class_Level=="UNDERGRADUATE") %>%
            group_by(College, .data[[input$breakdown]]) %>%
            summarise(Total=sum(SUM.HST.HEADCOUNT., na.rm=TRUE)) %>%
            spread(.data[[input$breakdown]], Total, fill=0) %>%
            as.data.frame() %>%
            mutate(TOTAL = rowSums(.[3:ncol(.)], na.rm=TRUE))
    })

    graduate_data1 <- reactive({
        selection1() %>%
            filter( Class_Level=="GRADUATE") %>%
            group_by(College, .data[[input$breakdown]]) %>%
            summarise(Total=sum(SUM.HST.HEADCOUNT., na.rm=TRUE)) %>%
            spread(.data[[input$breakdown]], Total, fill=0) %>%
            as.data.frame() %>%
            mutate(TOTAL = rowSums(.[3:ncol(.)], na.rm=TRUE))
    })


# <<<<<<<<<<<<<<<<<<<<<<<<<<<<  OUTPUTS  >>>>>>>>>>>>>>>>>>>>>>>>>>>>>>>>>>>>>>>

# <<<<<<<<<<<<<<<<  Enrollment University-wide Totals  >>>>>>>>>>>>>>>>>>>>>>>>>

    output$university_table1 <-
        DT::renderDT(datatable(university_data1(),
                            class = 'stripe hover compact table-condensed',
                            rownames = FALSE,
                            filter = 'top',
                            extensions = 'Buttons',
                            options = list(dom = 'trBi',
                                           buttons = c('copy', 'csv', 'excel', 'pdf', 'print'),
                            pageLength = 50)) %>%
        formatCurrency(c(2:10),currency = "", interval = 3, mark = ",", digits = 0))

# <<<<<<<<<<<<<<<<  Enrollment Undergraduate Tab  >>>>>>>>>>>>>>>>>>>>>>>>>>>>>>

    output$undergrad_table1 <-
        DT::renderDT(datatable(undergrad_data1(),
                            class = 'stripe hover compact table-condensed',
                            rownames = FALSE,
                            filter = 'top',
                            extensions = 'Buttons',
                            options = list(dom = 'trBi',
                                           buttons = c('copy', 'csv', 'excel', 'pdf', 'print'),
                            pageLength = 50)) %>%
        formatCurrency(c(2:10),currency = "", interval = 3, mark = ",", digits = 0))

# <<<<<<<<<<<<<<<<  Enrollment Graduate Tab  >>>>>>>>>>>>>>>>>>>>>>>>>>>>>>>>>>>

    output$graduate_table1 <-
        DT::renderDT(datatable(graduate_data1(),
                            class = 'stripe hover compact table-condensed',
                            rownames = FALSE,
                            filter = 'top',
                            extensions = 'Buttons',
                            options = list(dom = 'trBi',
                                           buttons = c('copy', 'csv', 'excel', 'pdf', 'print'),
                            pageLength = 50)) %>%
        formatCurrency(c(2:10),currency = "", interval = 3, mark = ",", digits = 0))

}

###############  APP!!!  #######################################################

shinyApp(ui = ui, server = server)

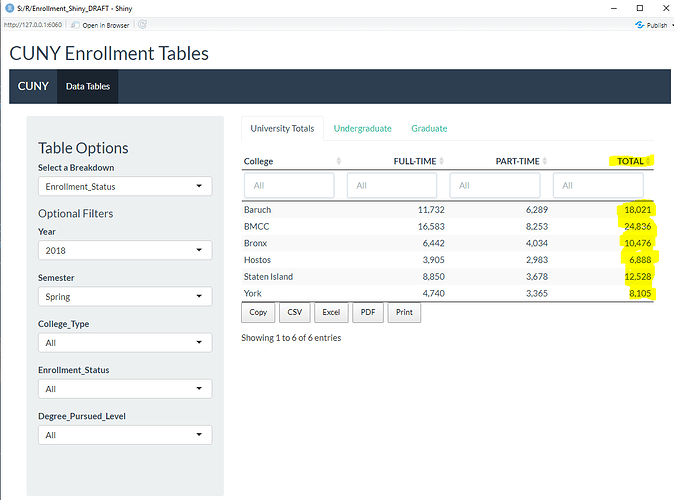
Here's a example of what happens when you filter for only doctoral degrees but view it on the undergraduate tab...
This article is for you !
https://shiny.rstudio.com/articles/validation.html

Hi @nirgrahamuk I thought that might be the case. I already looked at that article, but I couldn't get it to work with my code. I guess I could try something like the example below with multiple need statements:

  data <- reactive({
    validate(
      need(input$data != "", "Please select a data set"),
      need(input$data %in% c("mtcars", "faithful", "iris"),
        "Unrecognized data set"),
      need(input$data, "Input is an empty string"),
      need(!is.null(input$data),
        "Input is not an empty string, it is NULL")
    )
    get(input$data, 'package:datasets')
  })

but I am afraid the logic will get too complicated. There are too many combinations of filters that could cause an empty table, (my reprex only has a small subset of all my filters) so I wanted to do something that tests if the resulting table is empty or not, but couldn't figure out how to do that. I tried wrapping this part

    graduate_data1 <- reactive({
        selection1() %>%
            filter( Class_Level=="GRADUATE") %>%
            group_by(College, .data[[input$breakdown]]) %>%
            summarise(Total=sum(SUM.HST.HEADCOUNT., na.rm=TRUE)) %>%
            spread(.data[[input$breakdown]], Total, fill=0) %>%
            as.data.frame() %>%
            mutate(TOTAL = rowSums(.[3:ncol(.)], na.rm=TRUE))
    })

in validate/need functions but couldn't figure out how to test for an empty dataframe or if you can even use the validate/need functions to test a reactive object? I tried plyr's empty function but couldn't get that to work...

When I do this:

    output$graduate_table1 <- reactive({
        validate(
            need(plyr::empty(graduate_data1()), "There is no data that matches your filters!",
                 DT::renderDT(datatable(graduate_data1(),
                                        class = 'stripe hover compact table-condensed',
                                        filter = 'top',
                                        extensions = 'Buttons',
                                        options = list(dom = 'trBi',
                                                       buttons = c('copy', 'csv', 'excel', 'pdf', 'print'),
                                        pageLength = 50)) %>%
                    formatCurrency(c(2:10),currency = "", interval = 3, mark = ",", digits = 0))
            ))
        })

It tells me that "There is no data that matches your filters!" even when there is!

I know it's probably something really simple that I am missing... :frowning_face:

I think you would need your graduate_data1() to not be empty, exclamation mark for negation.
ie ! plyr::empty(
Also if you have whole list of inputs that you want to be 'truthy' have content, there are helper functions for such
for example

 validate(
      need(all(isTruthy(c(input$a,input$b))),"one of a or b isnt truthy")
    )
1 Like

Thanks! I just figured that out myself too! duh! So if I just put a exclamation point in there it doesn't give me the error anymore, but It doesn't render the table either. Just blank space where the table should be... :frowning:

I think you need to make the object that needs to know how render itself a render* type function rather than a reactive one:

output$graduate_table1 <- DT::renderDT({
  validate(
    need(! plyr::empty(graduate_data1()), "There is no data that matches your filters!")
  )
  datatable(graduate_data1(),
            class = 'stripe hover compact table-condensed',
            filter = 'top',
            extensions = 'Buttons',
            options = list(dom = 'trBi',
                           buttons = c('copy', 'csv', 'excel', 'pdf', 'print'),
                           pageLength = 50)) %>%
    formatCurrency(c(2:10),currency = "", interval = 3, mark = ",", digits = 0)
})

OK, so I took a few steps back and left my outputs the way they were and tried this...

    graduate_data1 <- reactive({
        validate(
            need("GRADUATE" %in% selection1()$Class_Level, "There is no data that matches your filters!"),
        )
        selection1() %>%
            filter( Class_Level=="GRADUATE") %>%
            group_by(College, .data[[input$breakdown]]) %>%
            summarise(Total=sum(SUM.HST.HEADCOUNT., na.rm=TRUE)) %>%
            spread(.data[[input$breakdown]], Total, fill=0) %>%
            as.data.frame() %>%
            mutate(TOTAL = rowSums(.[3:ncol(.)], na.rm=TRUE))
    })

But when I do that it gives me this error on the graduate tab... Error: argument is missing, with no default. So I assume the results of my dplyr code is not getting assigned to graduate_data1 for some reason...? So then I went back and tried to read the link you sent me more carefully and I think it's because the reactive object that you are validating has to be the same one you are using in the code below and since I was only validating one column of selection1() and the code below uses the whole of selection1() that's why it didn't work right? I'm just guessing...

So then I went back and tried this:

    output$graduate_table1 <-
        DT::renderDT({
            validate(
                need(!plyr::empty(graduate_data1()), "There is no data that matches your filters!")
            )
            datatable(graduate_data1(),
                            class = 'stripe hover compact table-condensed',
                            rownames = FALSE,
                            filter = 'top',
                            extensions = 'Buttons',
                            options = list(dom = 'trBi',
                                            buttons = c('copy', 'csv', 'excel', 'pdf', 'print'),
                            pageLength = 50)) %>%
        formatCurrency(c(2:10),currency = "", interval = 3, mark = ",", digits = 0)
            })

The table prints fine except when I select an undergraduate degree on the graduate tab I get the same undefined columns selected error, so the validation is not being reactive to changes in the filters.

So then I tried this:

    output$graduate_table1 <-
        DT::renderDT({
            reactive({
                validate(
                    need(!plyr::empty(graduate_data1()), "There is no data that matches your filters!")
                )
                datatable(graduate_data1(),
                        class = 'stripe hover compact table-condensed',
                        rownames = FALSE,
                        filter = 'top',
                        extensions = 'Buttons',
                        options = list(dom = 'trBi',
                                       buttons = c('copy', 'csv', 'excel', 'pdf', 'print'),
                        pageLength = 50)) %>%
                formatCurrency(c(2:10),currency = "", interval = 3, mark = ",", digits = 0)
            })
        })

But then I get this error: 'data' must be 2-dimensional (e.g. data frame or matrix)

I feel you are making progress :slight_smile:
This error just now, can happen when the content of graduate_data1() is NA.
so an easy check you can do in validate need is that it be 'truthy'

validate(
  need(isTruthy(graduate_data1()), "There is no such table"),
  need(!plyr::empty(graduate_data1()), "There is no data that matches your filters!")
)

Thanks! I agree, I think I am getting close! Thanks for all your help!

So I tried that but still get the same Error: 'data' must be 2-dimensional (e.g. data frame or matrix)

I think the problem is that maybe you can't put a reactive expression inside a render* expression? Because I get that error on the Graduate tab no matter what is filtered whether it contains Graduate data or not...

oh yes indeed.
reactives are there own expressions. I believe I saw that you had one for graduate_data1() higher up in your code.
Let me just delete what you dont need from your latest snippet:

output$graduate_table1 <-
  DT::renderDT({
    validate(
      need(isTruthy(graduate_data1()),
        "There is no such table"),
      need(!plyr::empty(graduate_data1()),
        "There is no data that matches your filters!")
    )
    datatable(graduate_data1(),
      class = "stripe hover compact table-condensed",
      rownames = FALSE,
      filter = "top",
      extensions = "Buttons",
      options = list(
        dom = "trBi",
        buttons = c("copy", "csv", "excel", "pdf", "print"),
        pageLength = 50
      )
    ) %>%
      formatCurrency(c(2:10),
        currency = "",
        interval = 3,
        mark = ",",
        digits = 0
      )
  })

I tried that one earlier already (and just tried it again by copying and pasting your code in case I typed something wrong earlier) and that one doesn't respond when you change the filter. The validation isn't reactive, so I get the same " Error: undefined columns selected " It doesn't re-validate when you change the filter. :frowning_face:

So it seems that if I put the validation in the render expression the validation isn't reactive, but if I put the validation in the reactive expression that creates the reactive data frame that is then passed into the render function it doesn't create my reactive data.frame correctly so I get Error: argument is missing, with no default no matter what filters are selected.

The problem is in the graduate_1 reactive.
I debugged by putting in a browser() statement and stepping through, running more and more of your pipe statements, here are the penultimate and last steps of an example:

# A tibble: 3 x 2
# Groups:   College [3]
  College       `FULL-TIME`
  <chr>               <dbl>
1 Baruch                610
2 Staten Island         173
3 York                   54
Browse[1]> selection1() %>%
+     filter( Class_Level=="GRADUATE") %>%
+     group_by(College, .data[[input$breakdown]]) %>%
+     summarise(Total=sum(SUM.HST.HEADCOUNT., na.rm=TRUE)) %>%
+     spread(.data[[input$breakdown]], Total, fill=0) %>%
+     as.data.frame() 
        College FULL-TIME
1        Baruch       610
2 Staten Island       173
3          York        54
Browse[1]> selection1() %>%
+     filter( Class_Level=="GRADUATE") %>%
+     group_by(College, .data[[input$breakdown]]) %>%
+     summarise(Total=sum(SUM.HST.HEADCOUNT., na.rm=TRUE)) %>%
+     spread(.data[[input$breakdown]], Total, fill=0) %>%
+     as.data.frame() %>%
+     mutate(TOTAL = rowSums(.[3:ncol(.)], na.rm=TRUE))
Error in `[.data.frame`(., 3:ncol(.)) : undefined columns selected

so the error is comming from your rowSums, I think you are trying to add columns that arent necessarily there. See the interim table showing two columns College and Full Time. what effect should Total achieve ? restate the Full Time value ?

Hi @betsyrosalen. You can add textOutput under each dataTableOutput to display the message. And use tryCatch to capture the error event, then clean the datatableOutput and display the error message.

###############  LOAD PACKAGES #################################################

library(shiny)
library(shinythemes)
library(dplyr)
library(tidyr)
library(DT)

###############  LOAD DATA  ####################################################

df <- structure(list(Year = c(rep(2017L, 93), rep(2018L, 90)),
                     Semester = c(rep("Fall", 45), rep("Spring", 48),
                                  rep("Fall", 44), rep("Spring", 46)),
                     College_Type = c(rep("Community", 18), rep("Senior", 27),
                                      rep("Community", 18), rep("Senior", 30),
                                      rep("Community", 18), rep("Senior", 26),
                                      rep("Community", 18), rep("Senior", 28)),
                     College = c(rep("BMCC", 6), rep("Bronx", 6), rep("Hostos", 6),
                                 rep("Baruch", 9), rep("Staten Island", 12), rep("York", 6),
                                 rep("BMCC", 6), rep("Bronx", 6), rep("Hostos", 6),
                                 rep("Baruch", 10), rep("Staten Island", 13),
                                 rep("York", 7), rep("BMCC", 6), rep("Bronx", 6), rep("Hostos", 6),
                                 rep("Baruch", 8), rep("Staten Island", 12), rep("York", 6),
                                 rep("BMCC", 6), rep("Bronx", 6), rep("Hostos", 6), rep("Baruch", 9),
                                 rep("Staten Island", 13), rep("York", 6)),
                     Class_Level = c(rep("UNDERGRADUATE", 18), rep("GRADUATE", 5),
                                     rep("UNDERGRADUATE", 4), rep("GRADUATE", 6),
                                     rep("UNDERGRADUATE", 6), rep("GRADUATE", 2),
                                     rep("UNDERGRADUATE", 22), rep("GRADUATE", 6),
                                     rep("UNDERGRADUATE", 4), rep("GRADUATE", 6),
                                     rep("UNDERGRADUATE", 7), rep("GRADUATE", 3),
                                     rep("UNDERGRADUATE", 22), rep("GRADUATE", 4),
                                     rep("UNDERGRADUATE", 4), rep("GRADUATE", 6),
                                     rep("UNDERGRADUATE", 6), rep("GRADUATE", 2),
                                     rep("UNDERGRADUATE", 22), rep("GRADUATE", 5),
                                     rep("UNDERGRADUATE", 4), rep("GRADUATE", 7),
                                     rep("UNDERGRADUATE", 6), rep("GRADUATE", 2),
                                     rep("UNDERGRADUATE", 4)),
                     Enrollment_Status = c(rep(c(rep("FULL-TIME",3),rep("PART-TIME",3)),3),
                                           rep("FULL-TIME",2), rep("PART-TIME",3),
                                           rep("FULL-TIME",2), rep("PART-TIME",2),
                                           rep("FULL-TIME",2), rep("PART-TIME",4),
                                           rep("FULL-TIME",3), rep("PART-TIME",3),
                                           "FULL-TIME", "PART-TIME", rep("FULL-TIME",2),
                                           "PART-TIME", "PART-TIME",
                                           rep(c(rep("FULL-TIME",3),rep("PART-TIME",3)),4),
                                           rep("FULL-TIME",2), rep("PART-TIME",2),
                                           rep("FULL-TIME",2), rep("PART-TIME",4),
                                           rep("FULL-TIME",4), rep("PART-TIME",3),
                                           "FULL-TIME",  rep("PART-TIME",2),
                                           rep("FULL-TIME",2), rep("PART-TIME",2),
                                           rep(c(rep("FULL-TIME",3),rep("PART-TIME",3)),3),
                                           rep(c(rep("FULL-TIME",2),rep("PART-TIME",2)),3),
                                           rep("PART-TIME",2), "FULL-TIME",
                                           rep("FULL-TIME",2), rep("PART-TIME",3),
                                           "FULL-TIME", "PART-TIME",
                                           rep("FULL-TIME",2), rep("PART-TIME",2),
                                           rep(c(rep("FULL-TIME",3),rep("PART-TIME",3)),3),
                                           rep("FULL-TIME",2), rep("PART-TIME",3),
                                           rep("FULL-TIME",2), rep("PART-TIME",2),
                                           rep("FULL-TIME",3), rep("PART-TIME",4),
                                           rep("FULL-TIME",3), rep("PART-TIME",3),
                                           "FULL-TIME", "PART-TIME",
                                           rep("FULL-TIME",2), rep("PART-TIME",2)),
                     Degree_Pursued_Level = c(rep(c("ASSOCIATE", "CERTIFICATE", "NONDEGREE"),6),
                                              "MASTER'S", "NONDEGREE", "ADVANCED CERTIFICATE",
                                              "MASTER'S", "NONDEGREE", rep(c("BACHELOR'S", "NONDEGREE"),2),
                                              "DOCTORAL", "MASTER'S", "ADVANCED CERTIFICATE",
                                              "DOCTORAL", "MASTER'S", "NONDEGREE",
                                              rep(c("ASSOCIATE", "BACHELOR'S", "NONDEGREE"),2),
                                              rep("MASTER'S",2), rep(c("BACHELOR'S", "NONDEGREE"),2),
                                              rep(c("ASSOCIATE", "CERTIFICATE", "NONDEGREE"),6),
                                              rep(c("ADVANCED CERTIFICATE", "MASTER'S", "NONDEGREE"),2),
                                              rep(c("BACHELOR'S", "NONDEGREE"),2),
                                              "DOCTORAL", "MASTER'S", "ADVANCED CERTIFICATE",
                                              "DOCTORAL", "MASTER'S", "NONDEGREE",
                                              "ASSOCIATE", "BACHELOR'S", "CERTIFICATE", "NONDEGREE",
                                              "ASSOCIATE", "BACHELOR'S", "NONDEGREE",
                                              rep("MASTER'S",2), "NONDEGREE",
                                              rep(c("BACHELOR'S", "NONDEGREE"),2),
                                              rep(c("ASSOCIATE", "CERTIFICATE", "NONDEGREE"),6),
                                              rep(c("MASTER'S", "NONDEGREE"),2),
                                              rep(c("BACHELOR'S", "NONDEGREE"),2),
                                              "DOCTORAL", "MASTER'S", "ADVANCED CERTIFICATE",
                                              "DOCTORAL", "MASTER'S", "NONDEGREE",
                                              rep(c("ASSOCIATE", "BACHELOR'S", "NONDEGREE"),2),
                                              rep("MASTER'S",2), rep(c("BACHELOR'S", "NONDEGREE"),2),
                                              rep(c("ASSOCIATE", "CERTIFICATE", "NONDEGREE"),6),
                                              "MASTER'S", "NONDEGREE", "ADVANCED CERTIFICATE", "MASTER'S",
                                              "NONDEGREE", rep(c("BACHELOR'S", "NONDEGREE"),2),
                                              rep(c("ADVANCED CERTIFICATE", "DOCTORAL", "MASTER'S"),2),
                                              "NONDEGREE", rep(c("ASSOCIATE", "BACHELOR'S", "NONDEGREE"),2),
                                              rep("MASTER'S",2), rep(c("BACHELOR'S", "NONDEGREE"),2)),
                     SUM.HST.HEADCOUNT. = c(18404,
                                            4, 71, 7017, 32, 1404, 7087, 57, 2, 2935, 91, 763, 4073, 19,
                                            73, 2385, 63, 598, 615, 18, 19, 2372, 12, 11541, 57, 3362, 293,
                                            59, 142, 62, 3, 674, 145, 4125, 5571, 14, 1129, 1293, 377, 126,
                                            14, 4976, 80, 2082, 1255, 16621, 5, 54, 7234, 33, 1405, 6443,
                                            49, 3, 3227, 97, 1001, 3784, 26, 45, 2358, 65, 701, 3, 577, 3,
                                            51, 2322, 6, 10760, 38, 3859, 326, 41, 107, 45, 19, 645, 129,
                                            3311, 5170, 1, 7, 1190, 1600, 360, 56, 37, 0, 4366, 52, 2239,
                                            1260, 18011, 5, 60, 7014, 33, 1383, 6637, 44, 4, 2778, 74, 982,
                                            4041, 22, 75, 2441, 59, 693, 527, 39, 2433, 6, 11442, 53, 3187,
                                            342, 60, 166, 59, 7, 629, 115, 3978, 5566, 23, 1003, 1268, 373,
                                            147, 51, 5003, 82, 2123, 1287, 16510, 4, 69, 6614, 35, 1604,
                                            6395, 42, 5, 2976, 93, 965, 3842, 22, 41, 2324, 55, 604, 606,
                                            4, 3, 2308, 11, 11051, 71, 3610, 357, 1, 39, 133, 41, 30, 653,
                                            120, 3525, 5141, 11, 1117, 1341, 376, 54, 75, 4627, 59, 2075,
                                            1215)),
                row.names = c(NA, -183L), class = "data.frame")

###############  DATA CLEANING AND PREP  #######################################

# Create Sorted Lists for dropdown menus
college <- df[, c("College")] %>% unique() %>% sort() %>% append("All")
year <- df[, c("Year")] %>% unique() %>% sort()
semester <- df[, c("Semester")] %>% unique() %>% sort()
college_type <- df[, c("College_Type")] %>% unique() %>% sort() %>% append("All")
class_level <- df[, c("Class_Level")] %>% unique() %>% sort() %>% append("All")
enrollment_status <- df[, c('Enrollment_Status')] %>% unique() %>% sort() %>% append("All")
degree_pursued <- df[, c('Degree_Pursued_Level')] %>% unique() %>% sort() %>% append("All")

breakdown_options <- names(df)[c(6,7)]

###############  USER INTERFACE  ###############################################

ui <- fluidPage(
 #themeSelector(),
 theme = shinytheme("flatly"),
 titlePanel('CUNY Enrollment Tables'),
 
 navbarPage("CUNY",
            
            # <<<<<<<<<<<<<<<<<<<<<<<  Enrollment Tables  >>>>>>>>>>>>>>>>>>>>>>>>>>>>>>>>>>
            
            tabPanel("Data Tables",
                     sidebarPanel(
                      h3('Table Options'),
                      selectInput('breakdown', 'Select a Breakdown',
                                  breakdown_options, selected='Degree_Status'),
                      h4('Optional Filters'),
                      selectInput('year', 'Year',
                                  year, selected=max(year)),
                      selectInput('semester', 'Semester',
                                  semester, selected='Spring'),
                      selectInput('college_type', 'College_Type',
                                  college_type, selected='All'),
                      selectInput('enrollment_status', 'Enrollment_Status',
                                  enrollment_status, selected='All'),
                      selectInput('degree_pursued', 'Degree_Pursued_Level',
                                  degree_pursued, selected='All'),
                      hr(),
                      br()
                     ),
                     mainPanel(
                      tabsetPanel(
                       tabPanel('University Totals',
                                br(),
                                dataTableOutput('university_table1'),
                                textOutput('university_message')
                       ),
                       tabPanel('Undergraduate',
                                br(),
                                dataTableOutput('undergrad_table1'),
                                textOutput('undergrad_message')
                       ),
                       tabPanel('Graduate',
                                br(),
                                dataTableOutput('graduate_table1'),
                                textOutput('graduate_message')
                       ),
                       id='DataTab'
                      )
                     )
            )
            
 )
)

###############  SERVER  #######################################################

server <- function(input, output) {
 
 # <<<<<<<<<<<<<<<<<<<<<<<  Reactive Data Prep  >>>>>>>>>>>>>>>>>>>>>>>>>>>>>>>>>
 
 # <<<<<<<<  Set up selections for "All" vs selected values in filters  >>>>>>>>>
 
 college_type_select <- reactive(
  if (input$college_type == "All") {
   head(college_type, n=-1)
  } else {input$college_type})
 
 enrollment_status_select <- reactive(
  if (input$enrollment_status == "All") {
   head(enrollment_status, n=-1)
  } else {input$enrollment_status})
 
 degree_pursued_select <- reactive(
  if (input$degree_pursued == "All") {
   head(degree_pursued, n=-1)
  } else {input$degree_pursued})
 
 
 # <<<<<<<<<<<<  Filter out unnecessary rows for Data Tables Tab >>>>>>>>>>>>>>>>
 
 selection1 <- reactive({
  df %>%
   filter( Year==input$year &
            Semester==input$semester &
            College_Type %in% college_type_select() &
            Enrollment_Status %in% enrollment_status_select() &
            Degree_Pursued_Level %in% degree_pursued_select())
 })
 
 university_data1 <- reactive({
  selection1() %>%
   group_by(College, .data[[input$breakdown]]) %>%
   summarise(Total=sum(SUM.HST.HEADCOUNT., na.rm=TRUE)) %>%
   spread(.data[[input$breakdown]], Total, fill=0) %>%
   as.data.frame() %>%
   mutate(TOTAL = rowSums(.[3:ncol(.)], na.rm=TRUE))
 })
 
 undergrad_data1 <- reactive({
  selection1() %>%
   filter( Class_Level=="UNDERGRADUATE") %>%
   group_by(College, .data[[input$breakdown]]) %>%
   summarise(Total=sum(SUM.HST.HEADCOUNT., na.rm=TRUE)) %>%
   spread(.data[[input$breakdown]], Total, fill=0) %>%
   as.data.frame() %>%
   mutate(TOTAL = rowSums(.[3:ncol(.)], na.rm=TRUE))
 })
 
 graduate_data1 <- reactive({
  selection1() %>%
   filter( Class_Level=="GRADUATE") %>%
   group_by(College, .data[[input$breakdown]]) %>%
   summarise(Total=sum(SUM.HST.HEADCOUNT., na.rm=TRUE)) %>%
   spread(.data[[input$breakdown]], Total, fill=0) %>%
   as.data.frame() %>%
   mutate(TOTAL = rowSums(.[3:ncol(.)], na.rm=TRUE))
 })


 # <<<<<<<<<<<<<<<<<<<<<<<<<<<<  OUTPUTS  >>>>>>>>>>>>>>>>>>>>>>>>>>>>>>>>>>>>>>>
 
 # <<<<<<<<<<<<<<<<  Enrollment University-wide Totals  >>>>>>>>>>>>>>>>>>>>>>>>>
 observe({
  output$university_message <- NULL
  tryCatch({
   dt <- datatable(university_data1(),
             class = 'stripe hover compact table-condensed',
             rownames = FALSE,
             filter = 'top',
             extensions = 'Buttons',
             options = list(dom = 'trBi',
                            buttons = c('copy', 'csv', 'excel', 'pdf', 'print'),
                            pageLength = 50)) %>%
    formatCurrency(c(2:10),currency = "", interval = 3, mark = ",", digits = 0)
   output$university_table1 <- DT::renderDT(dt)
  },
  error = function(e) {
   output$university_table1 <- DT::renderDT(NULL)
   output$university_message <- renderText(HTML("No data matches your filters"))
  })
 })


 # <<<<<<<<<<<<<<<<  Enrollment Undergraduate Tab  >>>>>>>>>>>>>>>>>>>>>>>>>>>>>>
 observe({
  output$undergrad_message <- NULL
  tryCatch({
   dt <- datatable(undergrad_data1(),
                   class = 'stripe hover compact table-condensed',
                   rownames = FALSE,
                   filter = 'top',
                   extensions = 'Buttons',
                   options = list(dom = 'trBi',
                                  buttons = c('copy', 'csv', 'excel', 'pdf', 'print'),
                                  pageLength = 50)) %>%
    formatCurrency(c(2:10),currency = "", interval = 3, mark = ",", digits = 0)
   output$undergrad_table1 <- DT::renderDT(dt)
  },
  error = function(e) {
   output$undergrad_table1 <- DT::renderDT(NULL)
   output$undergrad_message <- renderText(HTML("No data matches your filters"))
  })
 })
 
 # <<<<<<<<<<<<<<<<  Enrollment Graduate Tab  >>>>>>>>>>>>>>>>>>>>>>>>>>>>>>>>>>>
 observe({
  output$graduate_message <- NULL
  tryCatch({
   dt <- datatable(graduate_data1(),
                   class = 'stripe hover compact table-condensed',
                   rownames = FALSE,
                   filter = 'top',
                   extensions = 'Buttons',
                   options = list(dom = 'trBi',
                                  buttons = c('copy', 'csv', 'excel', 'pdf', 'print'),
                                  pageLength = 50)) %>%
    formatCurrency(c(2:10),currency = "", interval = 3, mark = ",", digits = 0)
   output$graduate_table1 <- DT::renderDT(dt)
  },
  error = function(e) {
   output$graduate_table1 <- DT::renderDT(NULL)
   output$graduate_message <- renderText(HTML("No data matches your filters"))
  })
 })


}

###############  APP!!!  #######################################################

shinyApp(ui = ui, server = server)
2 Likes

Ugh! Yes, that is because I missed something when pairing down my app to create a minimum reprex... That should be:

mutate(TOTAL = rowSums(.[2:ncol(.)], na.rm=TRUE))

Just need to change the 3 to a 2. I removed a column when I was pairing things down so now in some but not all circumstances there will never be more than 2 columns.

When you don't filter out the other columns that are in the breakdown it should add the columns together so you have a total for each row...

But with that said, I also missed some other things... I had also removed another variable in the reprex that I had as my default in the breakdown, so I fixed that from degree_status to enrollment_status too:

                selectInput('breakdown', 'Select a Breakdown',
                            breakdown_options, selected='Enrollment_Status'),

I almost had a panic attack just now because nothing was working at all! But a restart of RStudio fixed everything so it's all working fine again now... Everything works just fine without the validation as long as nobody filters out all the data!

1 Like

Thanks @raytong!

I didn't even know about tryCatch! It's a little more complicated than I thought it would be, but it works! And it's definitely way better than trying to make different menus for each scenario.

Thank you!

This topic was automatically closed 7 days after the last reply. New replies are no longer allowed.