I have a question about data prediction. For example, the gridded dataset DFgrid has four columns at the centroid of each grid cell: latitude, longitude, value, elevation. The point dataset DFpoint has three columns: latitude, longitude, elevation. The values can refer to temperature or precipitation. Like the below figure.
How to predict values from DFgrid to DFpoint? Thanks for your help.

It's a little hard to solve your exact problem without a reproducible example, but I think what you are looking for is the extract() function from the raster package. This means that you will need your data in the form of a raster package object, but there is a helper function in the raster package to do just that (rasterFromXYZ()).
Note that in the snippet below, I don't do library(raster), because the raster package interferes with the tidyverse methods when it is attached.
Hope this helps!
library(tidyverse)
DFgrid <- list(
longitude = seq(44, 45, length.out = 10),
latitude = seq(-64, -63, length.out = 10)
) %>%
cross_df() %>%
# make it so that higher values are to the northeast
mutate(value = longitude - 44 + latitude + 64)
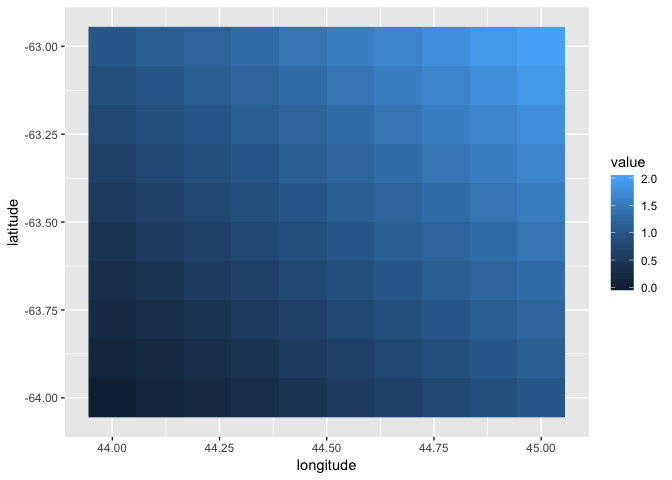
# I'm guessing this is what your DFgrid looks like?
DFgrid
#> # A tibble: 100 x 3
#> longitude latitude value
#> <dbl> <dbl> <dbl>
#> 1 44 -64 0
#> 2 44.1 -64 0.111
#> 3 44.2 -64 0.222
#> 4 44.3 -64 0.333
#> 5 44.4 -64 0.444
#> 6 44.6 -64 0.556
#> 7 44.7 -64 0.667
#> 8 44.8 -64 0.778
#> 9 44.9 -64 0.889
#> 10 45 -64 1
#> # … with 90 more rows
ggplot(DFgrid, aes(longitude, latitude, fill = value)) +
geom_raster()
# create a raster object
rast_obj <- DFgrid %>%
  # column order (X, Y, Z) matters
  select(longitude, latitude, value) %>%
  raster::rasterFromXYZ()

# create an X, Y data frame (order matters!)
new_points <- tibble(
  longitude = c(44.1, 44.9),
  latitude = c(-63.9, -63.1)
)

# use raster::extract(<raster object>, <XY data frame of coordinates>),
# which returns a vector with the same number of rows as the data frame
new_points$value <- raster::extract(rast_obj, new_points)

new_points
#> # A tibble: 2 x 3
#>   longitude latitude value
#>       <dbl>    <dbl> <dbl>
#> 1      44.1    -63.9 0.222
#> 2      44.9    -63.1 1.78
Created on 2019-03-14 by the reprex package (v0.2.1)
1 Like
Thanks. Yes, this is what I want to do, but there is a little more than that. For example, this may be good for precipitation data, but I also have one additional column 'elevation' for both DFgrid and new_points dataframes. I think that for temperature, it is necessary to consider lapse rate which comes from elevation? How to add this factor when do the prediction? Thanks again.
It looks like raster::rasterFromXYZ() and raster::extract() work with more than one attribute, which means you can do this:
library(tidyverse)

DFgrid <- list(
  longitude = seq(44, 45, length.out = 10),
  latitude = seq(-64, -63, length.out = 10)
) %>%
  cross_df() %>%
  # make it so that higher values are to the northeast
  mutate(
    elevation = longitude - 44 + latitude + 64,
    precip = 1,
    temp = 12
  )

# create a raster object using all the attributes (X and Y first)
rast_obj <- DFgrid %>%
  raster::rasterFromXYZ()

# create an X, Y data frame
new_points <- tibble(
  longitude = c(44.1, 44.9),
  latitude = c(-63.9, -63.1)
)

# use raster::extract(<raster object>, <XY data frame of coordinates>),
# which returns a matrix that we can cbind() with the new points
bind_cols(
  new_points,
  as_tibble(raster::extract(rast_obj, new_points))
)
#> # A tibble: 2 x 5
#>   longitude latitude elevation precip  temp
#>       <dbl>    <dbl>     <dbl>  <dbl> <dbl>
#> 1      44.1    -63.9     0.222      1    12
#> 2      44.9    -63.1     1.78       1    12
1 Like
This topic was automatically closed 21 days after the last reply. New replies are no longer allowed.
If you have a query related to it or one of the replies, start a new topic and refer back with a link.