I have a step-wise function. It is a function with theta.
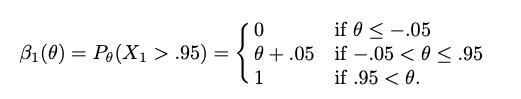
I have a step-wise function. It is a function with theta.
See the FAQ: How to do a minimal reproducible example reprex for beginners.
If the question is about plotting, a representative data set is needed. If it's about creating the data frame, do you mean \beta_{i\dots n}, etc? Otherwise, what are P_\theta and X_1?
There is no data. Just plot this function. No restriction of theta. Theta is from negative infinity to positive infinity. And the range is from 0 to 1.
Please ignore P_θ. The function is called \beta_1, in terms of \theta.
Still not sure of your intent. Also assumed that the third condition was 0.95 >
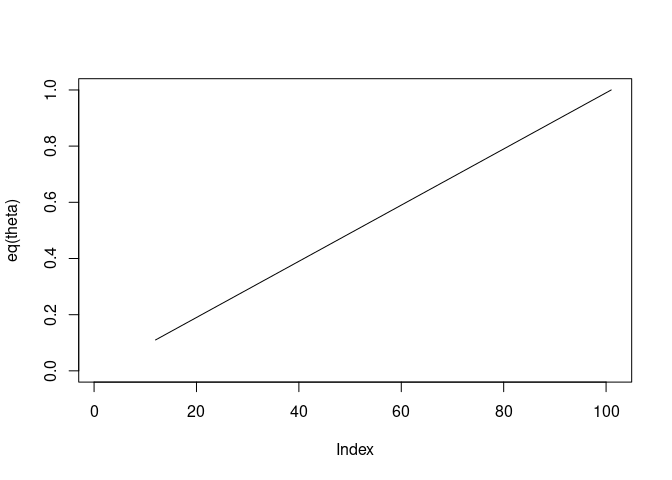
theta <- seq(-0.05,0.95,.01)
eq <- function(x) dplyr::case_when(
  x <= -0.05 ~ 0,
  x > 0.05 & x <= 0.95 ~ x + 0.05,
  x > 0.95 ~ 1
  )

plot(eq(theta), type = 'l')
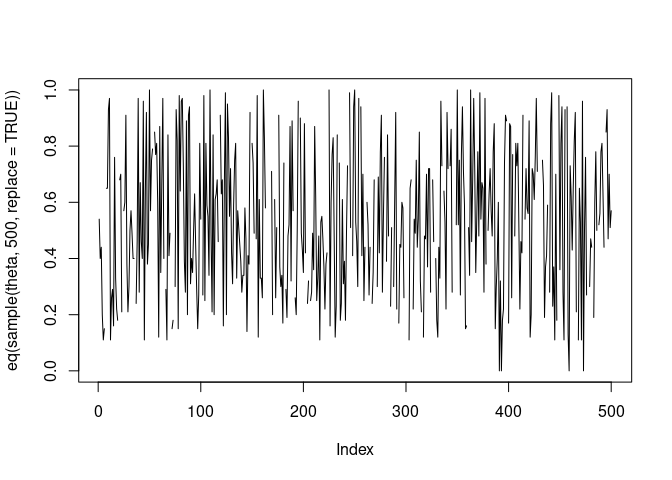
plot(eq(sample(theta,500, replace = TRUE)), type = 'l')
Okay, think about this way. We have a function f(x).
When x <= -0.05, f(x)=0
When -0.05<x <=0.95, then f(x)=x+0.05
When x>0.95, f(x)=1
Please plot the curve of f(x).
See the FAQ: How to do a minimal reproducible example reprex for beginners.
If
eq <- function(x) dplyr::case_when(
  x <= -0.05 ~ 0,
  x > 0.05 & x <= 0.95 ~ x + 0.05,
  x > 0.95 ~ 1
  )
isn't what you intended, provide a replacement.
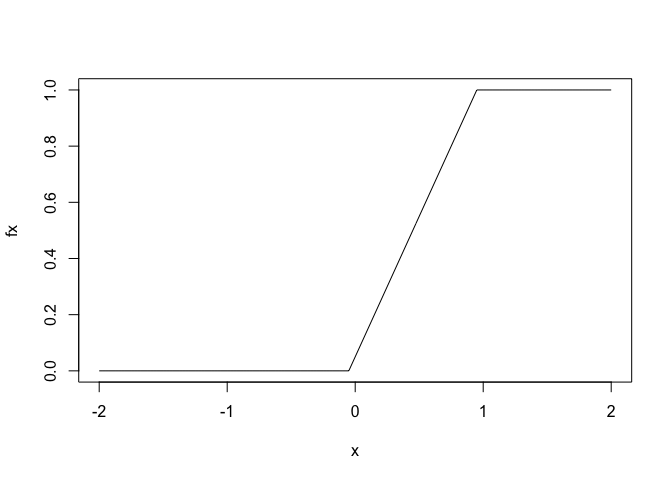
One way to generate data explicitly in a bounded interval and plot the function.
library(tidyverse)
x<-seq(-2,2, 0.025)
fx_gen<-function(x){
  fx<-1
  if(x <= -0.05){
    fx<-0
  }else if(-0.05<x & x<=0.95){
    fx<-x+0.05
  }
  return(fx)
}
fx<-map_dbl(x, ~fx_gen(.x))
plot(x,fx,type = "l")
This topic was automatically closed 7 days after the last reply. New replies are no longer allowed.
If you have a query related to it or one of the replies, start a new topic and refer back with a link.