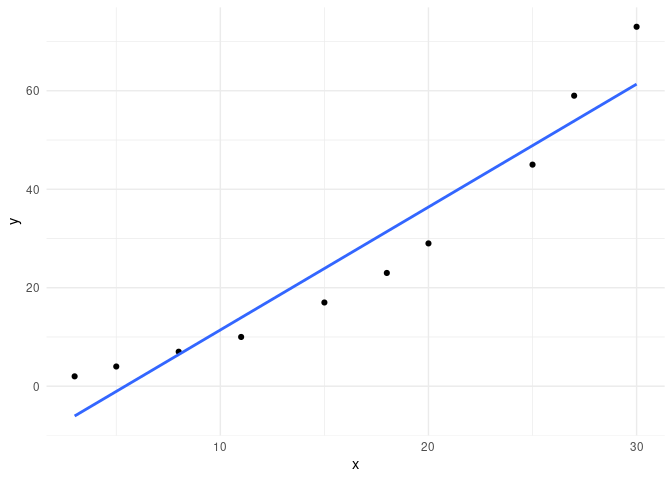
Plot these data and the fitted line.
x <- c(3, 5, 8, 11, 15, 18, 20, 25, 27, 30)
y <- c(2, 4, 7, 10, 17, 23, 29, 45, 59, 73)
My fitted line is y=-13.2+2.375x. How to draw these points and the fitted line in the same graph?
Plot these data and the fitted line.
x <- c(3, 5, 8, 11, 15, 18, 20, 25, 27, 30)
y <- c(2, 4, 7, 10, 17, 23, 29, 45, 59, 73)
My fitted line is y=-13.2+2.375x. How to draw these points and the fitted line in the same graph?
suppressPackageStartupMessages({
  library(ggplot2)
})

dat <- data.frame(
  x = c(3, 5, 8, 11, 15, 18, 20, 25, 27, 30),
  y = c(2, 4, 7, 10, 17, 23, 29, 45, 59, 73)
)

p <- ggplot(dat,aes(x,y))
p + geom_point() + geom_smooth(method = "lm", se = FALSE) + theme_minimal()
#> `geom_smooth()` using formula 'y ~ x'
Thank you for help. But I need to specify the line y=-13.2+2.375x, not any other line. Because I use nonparametric method to derive the line. I need to know how well this method works.
\dots are slightly different from ordinary least squares regression. Are you sure they are what you want?
dat <- data.frame(
  x = c(3, 5, 8, 11, 15, 18, 20, 25, 27, 30),
  y = c(2, 4, 7, 10, 17, 23, 29, 45, 59, 73)
)

summary(lm(y~x, data = dat)) -> a
a$coefficients[,1]
#> (Intercept)           x
#>  -13.543129    2.496489
dat <-
  data.frame(
    x = c(3, 5, 8, 11, 15, 18, 20, 25, 27, 30),
    y = c(2, 4, 7, 10, 17, 23, 29, 45, 59, 73)
  )

# My fitted line is y=-13.2+2.375x.

dat$myy <- -13.2 + 2.375 * dat$x

library(ggplot2)
ggplot(dat, aes(x, y)) +
  geom_point() +
  # geom_smooth(method = "lm", se = FALSE) +
geom_line(aes(y = myy), color = "red")You can use geom_abline to define a line with its slope and intercept:
ggplot(dat, aes(x, y)) +
  geom_point() +
  geom_abline(slope = 2.375,
              intercept = -13.2,
              colour = "blue")
This topic was automatically closed 7 days after the last reply. New replies are no longer allowed.
If you have a query related to it or one of the replies, start a new topic and refer back with a link.