To be frank, I'm not totally sure I understand what you want. But here's an attempt with your latest dataset:
library(dplyr)
#>
#> Attaching package: 'dplyr'
#> The following objects are masked from 'package:stats':
#>
#>     filter, lag
#> The following objects are masked from 'package:base':
#>
#>     intersect, setdiff, setequal, union
library(ggplot2)

sample_data <- data.frame(Date = c("28-May-21", "27-May-21", "26-May-21", "15-Jun-20", "14-Jun-20", "13-Jun-20", "13-Jul-19", "14-Jul-19", "15-Jul-19", "26-May-18", "25-May-18", "24-May-18", "28-Jun-17", "27-Jun-17", "26-Jun-17"),
                          Value = c(112, 108, 115, 95, 103, 112, 85, 95, 110, 105, 108, 112, 85, 95, 100),
                          Year = c(2020, 2020, 2020, 2019, 2019, 2019, 2018, 2018, 2018, 2017, 2017, 2017, 2016, 2016, 2016))

sample_data %>%
    mutate(Date = as.Date(x = Date,
                          format = "%d-%b-%y"),
           Date_Factor = factor(x = format(x = Date,
                                           format = "%b %d"),
                                levels = paste(rep(x = month.abb,
                                                   each = 31),
                                               formatC(x = 1:31,
                                                       width = 2,
                                                       flag = "0"))),
           Year = as.factor(x = Year)) %>%
    ggplot(mapping = aes(x = Date_Factor,
                         y = Value)) +
    geom_line(mapping = aes(group = Year,
                            colour = Year))
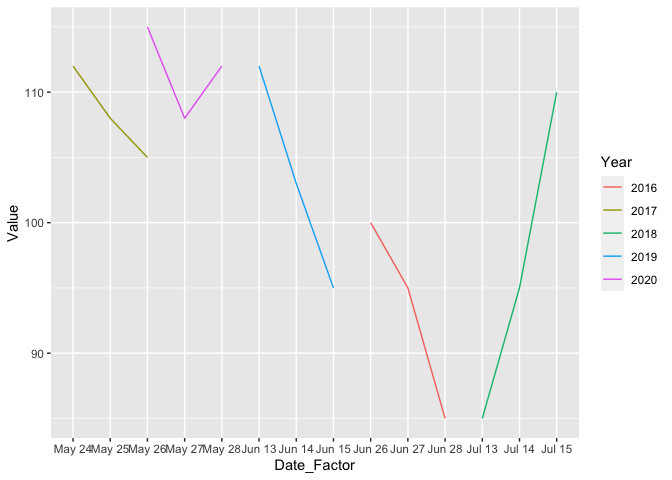
Created on 2021-05-30 by the reprex package (v2.0.0)
NB: You may note that I used 31*12 days in a year. That's just because it'd do the job quickly. You can correct it, of course.