Hi, I'm quite new to R and am using it for my marine biology degree.
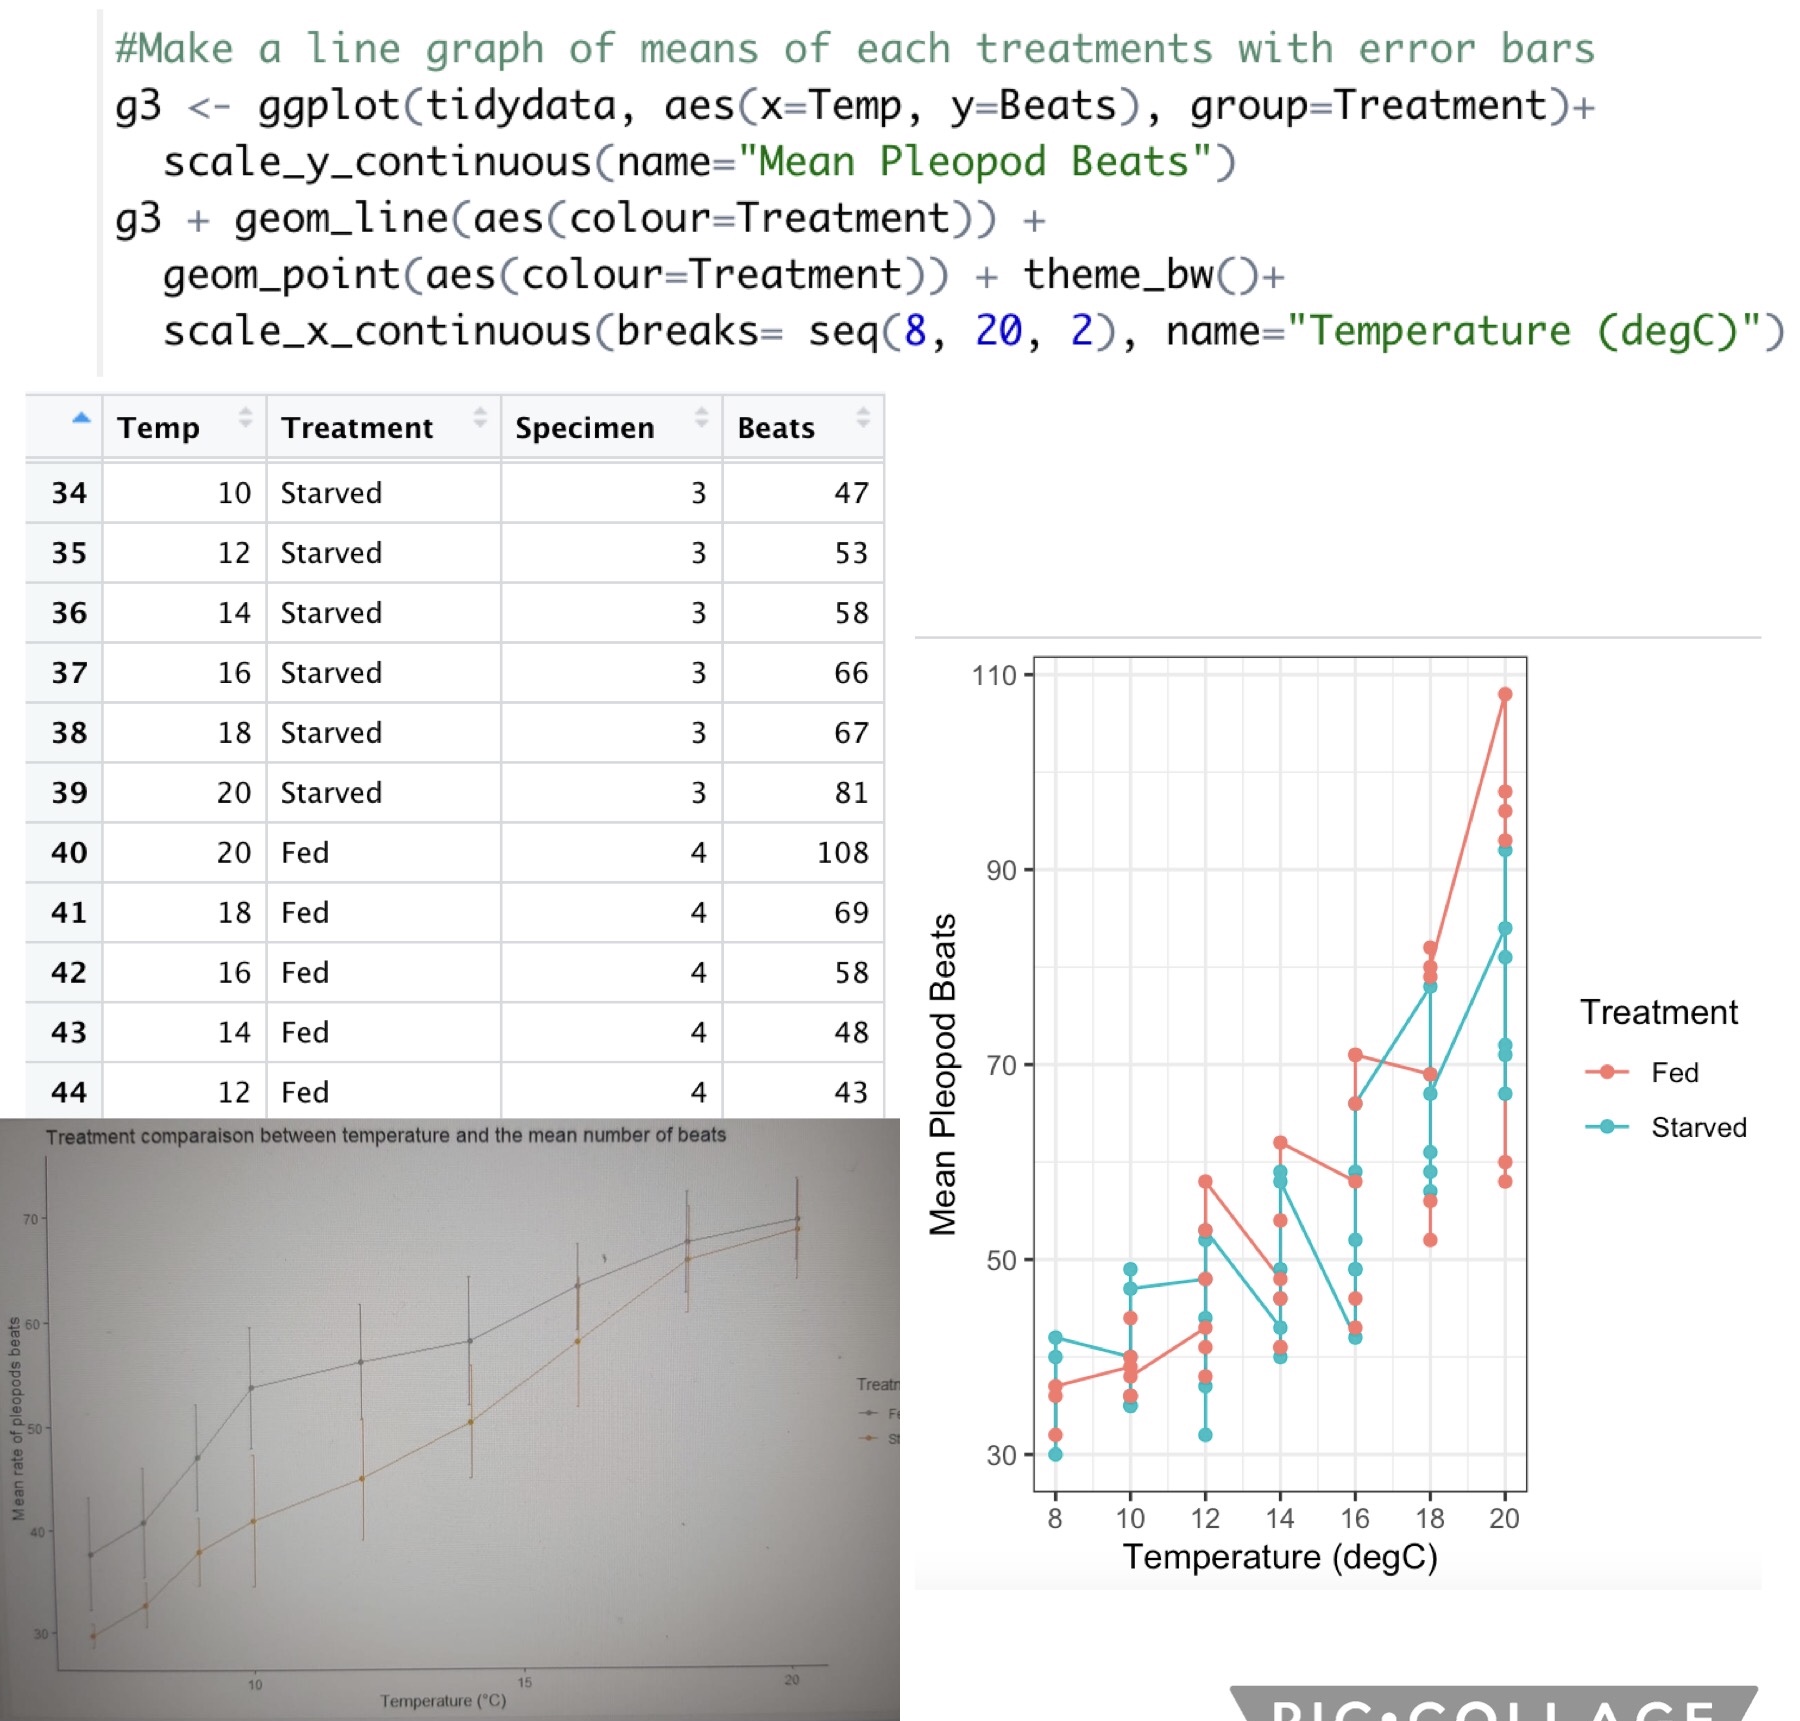
I am trying to produce a graph plotting y='Mean Beats' and x=Temperature but I have two different categories to plot as individual lines -'Fed' and 'Starved' which are under the column 'Treatment'. I want to plot the means of each category per temperature but don't know the right code for it. I'll attach what I've got so far, my code, a portion of my table for reference as well as a screenshot of what I'm aiming to create.. Hope someone has some advice :)!!
Hi!
I'm afraid screenshots of your data and code are not very helpful and even a bad practice here.
To help us help you, could you please prepare a reproducible example (reprex) illustrating your issue? Please have a look at this guide, to see how to create one:
This topic was automatically closed 7 days after the last reply. New replies are no longer allowed.
If you have a query related to it or one of the replies, start a new topic and refer back with a link.