Hi all,
EDIT: of course 10 minutes after working on this post I found the solution to the problem mysef... Moving colour=cyl from ggplot to geom_point() worked as cyl isn't present in my data frame lines. However, I still don't understand one thing and I would be greatful it you could help me with it: using inherit.aes = F should also do the trick, right? But how do I use it correctly in the example below? Thanks!
I'm having some trouble plotting simple stuff using geom_vline() and geom_text() in conjunction with colour. Part of my question relates to understanding why the following happens: when plotting data and adding vertical lines with some text, if I add colour in aes() R throws an error that the object can't be found. Could you help me understand this behaviour? I've reproduced my problem below using mtcars. (Also, I couldn't think of a better title for this thread. Happy to change it to something more suitable if you have something in mind that describes the problem better).
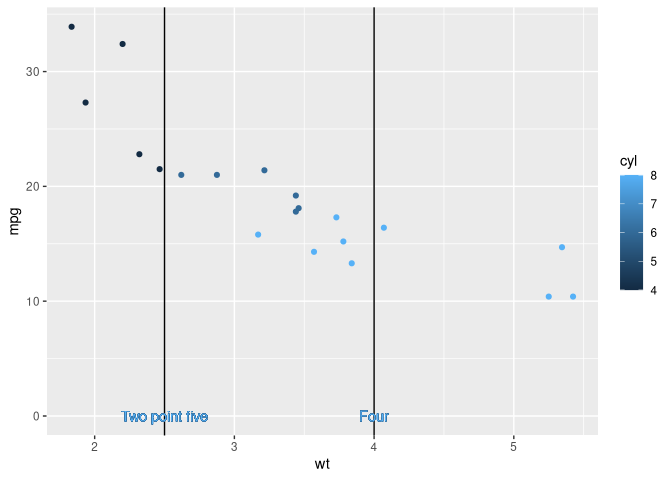
Say I want to plot two variables and additionally draw two vertical lines meaningful to my project. The lines must have added text. I can achieve this with:
library(tidyverse)

data(mtcars)

groups <- c(1, 3, 4)

lines <- data.frame(vlines = c(2.5, 4), labels = c("Two point five", "Four"), stringsAsFactors = FALSE)

mtcars %>%
  filter(carb %in% groups) %>%
  ggplot(aes(wt, mpg)) +
  geom_point() +
  geom_vline(data = lines, aes(xintercept = vlines)) +
  geom_text(data = lines, aes(x = vlines, y = 0, label = labels))

Created on 2020-04-18 by the reprex package (v0.3.0)
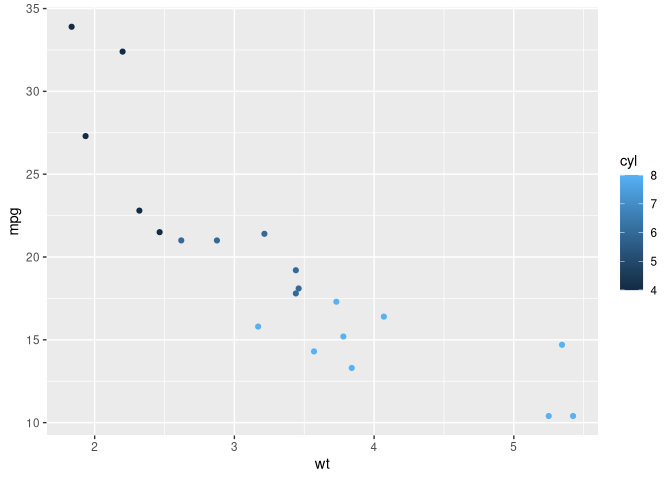
Now let's say I want to do the same but visualising the data by number of cylinders. Tentatively I'd do:
mtcars %>%
  filter(carb %in% groups) %>%
  ggplot(aes(wt, mpg, colour = cyl)) +
  geom_point() +
  geom_vline(data = lines, aes(xintercept = vlines)) +
  geom_text(data = lines, aes(x = vlines, y = 0, label = labels))
#> Error in FUN(X[[i]], ...): object 'cyl' not found
Created on 2020-04-18 by the reprex package (v0.3.0)
As you can see adding colour = cyl makes R complain that cyl isn't there. Same plot without geom_vline() and geom_text() works just fine:
mtcars %>%
  filter(carb %in% groups) %>%
  ggplot(aes(wt, mpg, colour = cyl)) +
  geom_point()
Created on 2020-04-18 by the reprex package (v0.3.0)
I understand that it has to do with using the points and labels for the vertical lines as a data frame, because if I instruct R to draw the lines and their text "manually" on a per-case basis it works just fine:
mtcars %>%
  filter(carb %in% groups) %>%
  ggplot(aes(wt, mpg, colour = cyl)) +
  geom_point() +
  geom_vline(xintercept = 2.5) +
  geom_text(aes(x = 2.5 , y = 0, label = "Two point five")) +
  geom_vline(xintercept = 4) +
  geom_text(aes(x = 4 , y = 0, label = "Four"))
Created on 2020-04-18 by the reprex package (v0.3.0)
However, in my real problem I have a bigger number of lines (and therefore text) to draw, thus I'd like to use a different approach (as in specifying in geom_vline() a data frame with all the info needed to draw the lines and respective text).
Could you explain me why this behaviour occurs and how I could solve it? Thanks so much!