Hello!
I'm trying to write a code on a random walk in 2d. This random walk is biased: the probability to choose the next step (vertex) depends on the number of time the walker has already chosen this vertex.
Next_step = function(i,j,Grille){

    l = nrow(Grille)
    prob = rep(NA,4)

    prob[1] = Grille[i+1,j]/(Grille[i,j-1]+Grille[i,j+1]+Grille[i-1,j]+Grille[i+1,j])
    prob[2] = Grille[i,j+1]/(Grille[i,j-1]+Grille[i,j+1]+Grille[i-1,j]+Grille[i+1,j])
    prob[3] = Grille[i,j-1]/(Grille[i,j-1]+Grille[i,j+1]+Grille[i-1,j]+Grille[i+1,j])
    prob[4] = Grille[i-1,j]/(Grille[i,j-1]+Grille[i,j+1]+Grille[i-1,j]+Grille[i+1,j])
    next_step = sample(1:4, 1,replace = TRUE, prob = prob)


    if (next_step == 1) { # en bas
      i = i+1
    } else if (next_step == 2) {  # à droite
      j = j+1
    } else if (next_step == 3) { # à gauche
      j= j-1
    } else if (next_step == 4) { # en haut
      i = i-1
    }
  return(c(i,j))
}


RW_2d = function(nRow,nCol,pas){

  #nRow = 6
  #nCol = 6

  Grille = matrix(1, nrow = nRow+2, ncol = nCol+2)
  Grille[c(1,nRow+2),] = 0
  Grille[,c(1,nRow+2)]=0

  axe_x = rep(NA,pas)
  axe_y = rep(NA,pas)
  d = rep(NA,2)

  axe_x[1] = sample(1:nRow,1)
  axe_y[1] = sample(1:nCol,1)
  Grille[axe_x[1],axe_y[1]] = Grille[axe_x[1],axe_y[1]]+1
  for (i in 2:pas){
    d[1:2]= Next_step(axe_x[i-1],axe_y[i-1],Grille)
    axe_x[i]=d[1]
    axe_y[i]=d[2]
    Grille[d[1],d[2]] = Grille[d[1],d[2]]+1
  }
  plot(axe_x,axe_y,type = 'l')
  return(Grille)
}
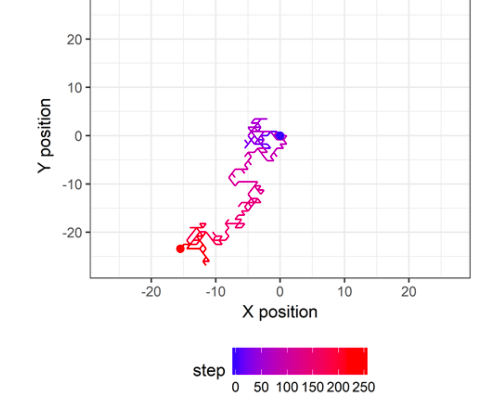
I want to plot this with colors like in this image but I don't know how?

Does anyone have an idea?
Moreover, how can I represent the number of passages by each vertex with "heat map" or another function?
Thank you !