In order to train myself, I try to reproduce this image, but don't know how to draw the red line under subtitle.
I tried to do it with ggtext, but failed
library(tidyverse)
library(ggtext)
d <- tibble::tribble(
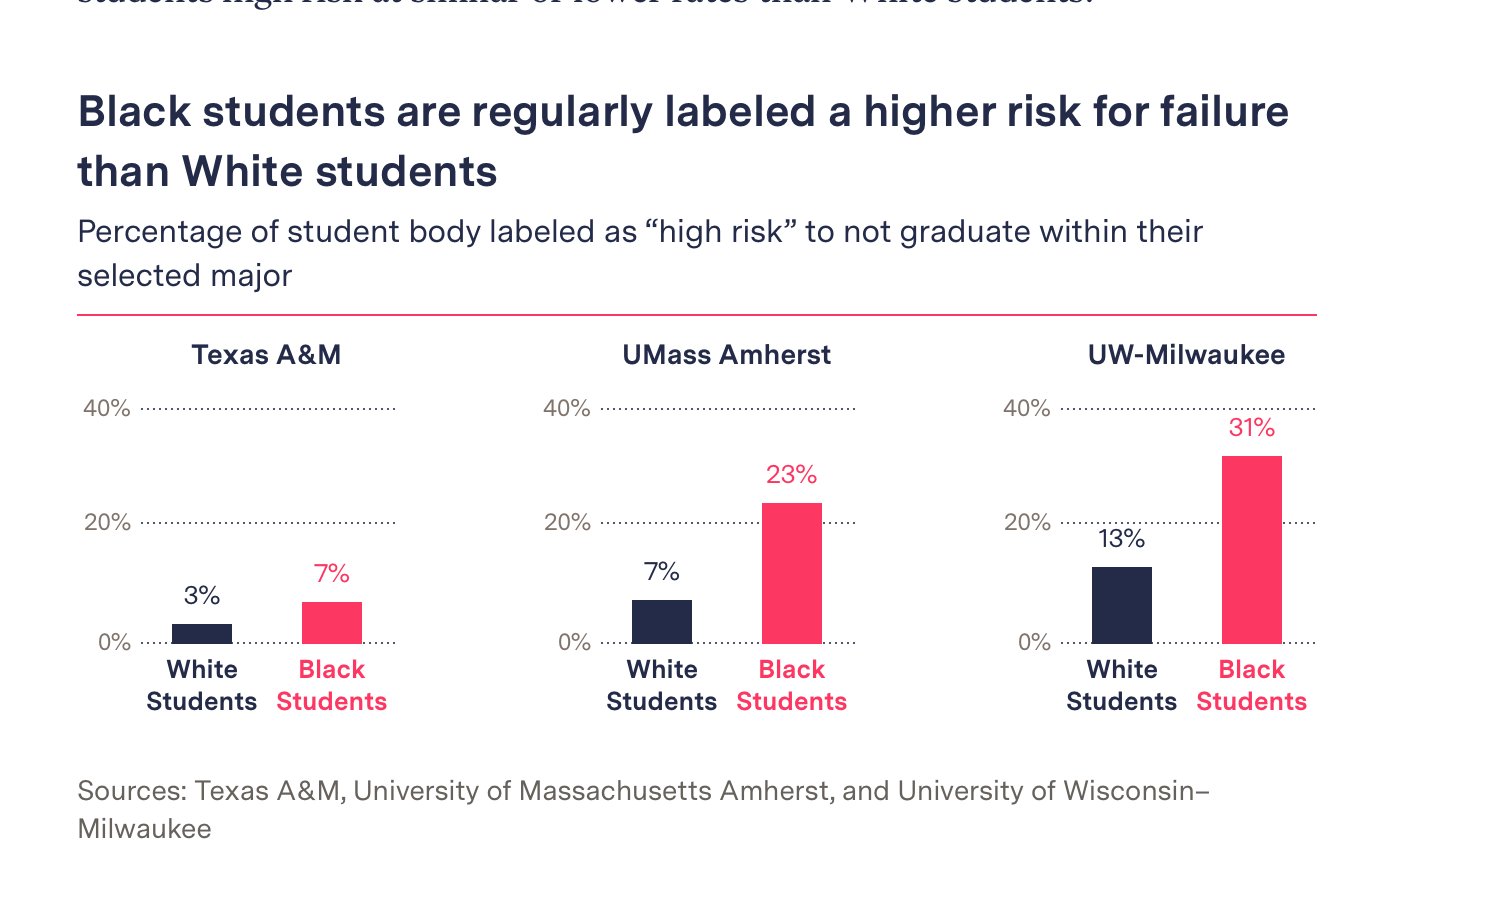
~area, ~group, ~value,
"Texas A&M", "white Students", 0.03,
"Texas A&M", "Black Students", 0.07,
"Umass Amherst", "white Students", 0.07,
"Umass Amherst", "Black Students", 0.23,
"UW-Milwaukee", "white Students", 0.13,
"UW-Milwaukee", "Black Students", 0.31
)
d %>%
mutate(
across(group, as_factor),
) %>%
ggplot(aes(x = group, y = value, color = group, fill = group)) +
geom_col(width = 0.4) +
geom_text(aes(label = scales::label_percent(scale = 100, accuracy = 1)(value)),
vjust = -1,
size = rel(6),
fontface = "bold"
) +
facet_wrap(vars(area), ncol = 3, scales = "free_y") +
scale_x_discrete(
labels = function(x) str_replace(x, " ", "\n"),
expand = expansion(mult = .8)
) +
scale_y_continuous(
limits = c(0, 0.46),
breaks = c(0, 0.2, 0.4),
labels = scales::label_percent(scale = 100, accuracy = 1),
expand = expansion(mult = 0)
) +
scale_fill_manual(
values = c("white Students" = "#252A4A", "Black Students" = "#F42F5D"),
aesthetics = c("colour", "fill")
) +
theme(
legend.position = "none",
plot.title = element_text(size = rel(2)),
plot.subtitle = element_markdown(),
plot.caption = element_text(size = 12, color = "grey50", hjust = 0),
axis.text.y = element_text(size = rel(1.5)),
axis.text.x = element_text(
size = rel(1.5),
face = "bold",
color = c("#252A4A", "#F42F5D")
),
axis.ticks = element_blank(),
panel.background = element_rect(color = "white", fill = NA),
panel.grid.major.y = element_line(
colour = "gray",
size = 0.8,
linetype = "dotted"
),
strip.background = element_blank(),
strip.text = element_text(face = "bold", size = rel(1)),
panel.spacing = unit(2, "lines")
) +
labs(
title = "Black students are regularly labeled a higher risk for failure\nthan White students",
subtitle = "<span style = 'font-size:13pt; '>Percentage of student body labeled as high risk to not graduate within their <br> selected major</span><br>
<span style = 'color:#F42F5D; '>---</span>",
caption = "Sources: Texas A&M, University of Massachusetts Amherst, and University of Wisconsin–\nMilwaukee",
x = NULL, y = NULL
)