The tidy way of doing this would be to join your data sets and reshape them into a long format but, it is posible to manually map aesthetics so you can get a legend, this is an example using a buil-in data frame
library(ggplot2)
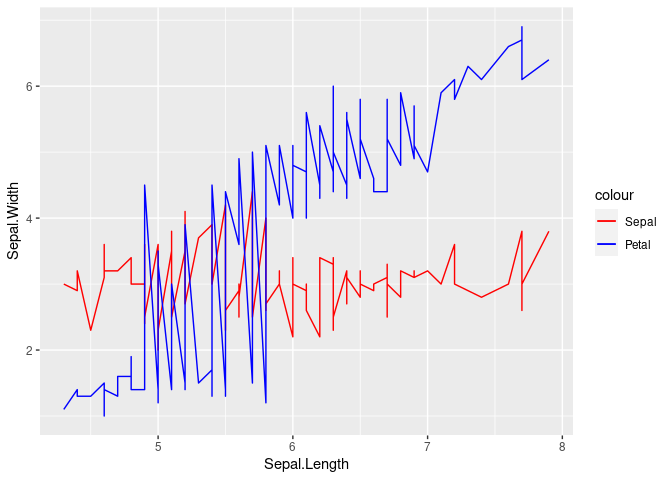
legend_colors <- c("Sepal" = "red", "Petal" = "blue")
ggplot() +
geom_line(data = iris, aes(x = Sepal.Length, y = Sepal.Width, color = "Sepal")) +
geom_line(data = iris, aes(x = Sepal.Length, y = Petal.Length, color = "Petal")) +
scale_color_manual(values = legend_colors)
Created on 2021-08-05 by the reprex package (v2.0.0)
If you need more specific help, please provide a proper REPRoducible EXample (reprex) illustrating your issue.