Hi
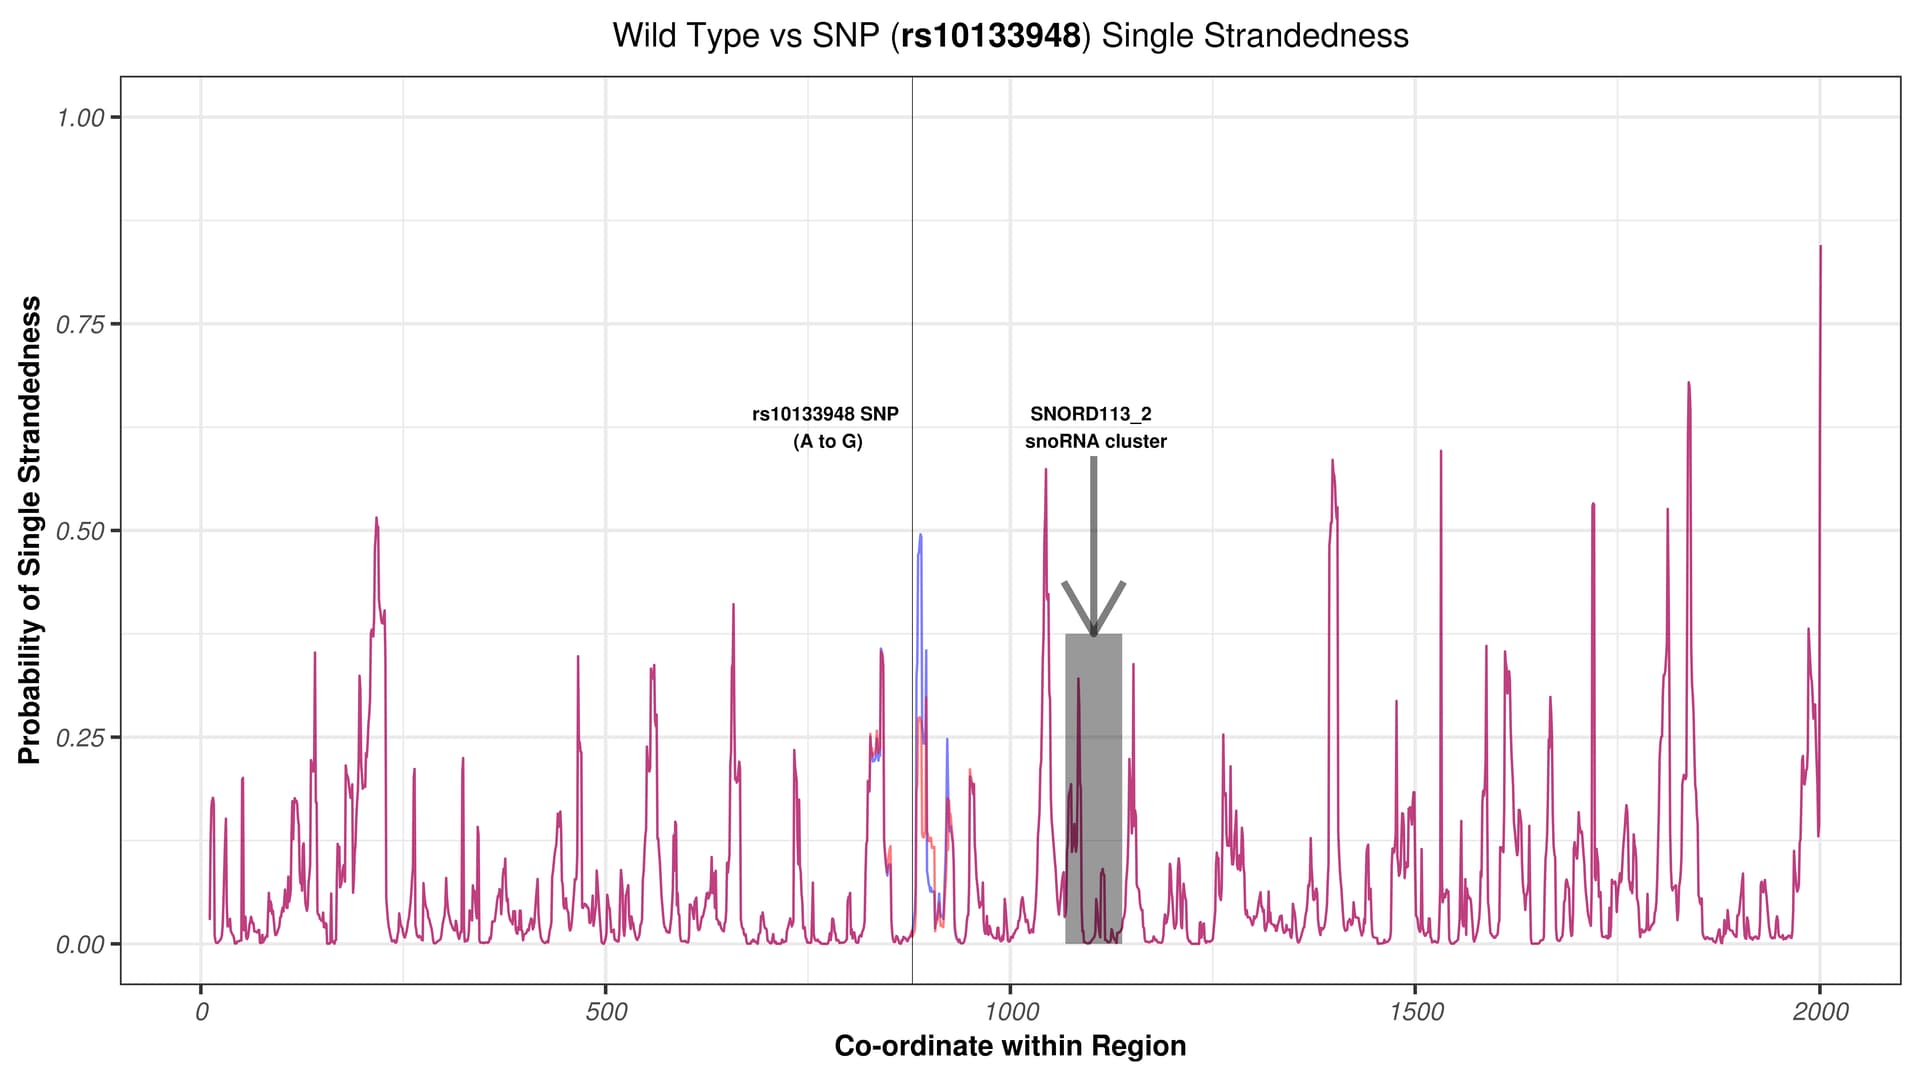
I'm trying to use the following Code to plot data, but no legend appears (image attached). could anyone provide any advice?
# Plotting Wild Type vs SNP single strandedness for SNP rs10133948 (chr14:100927153)

rs10133948_title <- expression(paste("Wild Type vs SNP (", italic(bold("rs10133948")), ") Single Strandedness"))

plot_rs10133948 <- ggplot() +
  geom_line(data=rs10133948WT_lunp,  aes(x=pos, y=p10*scaleFactor), size=0.35, color="blue", linetype="solid", alpha=0.5) +
  geom_line(data=rs10133948SNP_lunp, aes(x=pos, y=p10*scaleFactor), size=0.35, color="red",  linetype="solid", alpha=0.5) +
  scale_y_continuous(name= "Probability of Single Strandedness", limits=c(0.000, 1) ) +
  scale_x_continuous(name = "Co-ordinate within Region", limits=c(0.000, 2001)) +
  ggtitle(rs10133948_title) +
  theme_bw() +
  theme(axis.text=element_text(face = "italic", size = 7.5),
        axis.title=element_text(face= "bold", size = 8.5),
        plot.title=element_text(family='', color='black', size=10, hjust=0.5, vjust=0.5))

plot_rs10133948 +
  annotate("text", x = 775, y = 0.625, label = c("rs10133948 SNP \n(A to G)") , color = "black", size = 2, angle = 0, fontface = "bold") +
  geom_vline(xintercept=879, color="black", size=0.1, alpha = 1) +
  annotate("rect", xmin = 1068, xmax = 1138, ymin = 0, ymax = 0.375, color = "blue", alpha = 0.4, size = 0.0010, fill = "black") +
  annotate("segment", x = 1103, xend = 1103, y = 0.59, yend = 0.375, color = "black", size = 1, alpha = 0.5, arrow = arrow()) +
  annotate("text", x = 1103, y = 0.625, label = c("SNORD113_2 \n snoRNA cluster") , color = "black", size = 2, angle = 0, fontface = "bold")

ggsave("rs10133948 WT vs SNP.png", dpi = 1200, dev = 'png', height = 4.5, width = 8, units = "in")
thanks!