Hi,
Welcome to the forums.
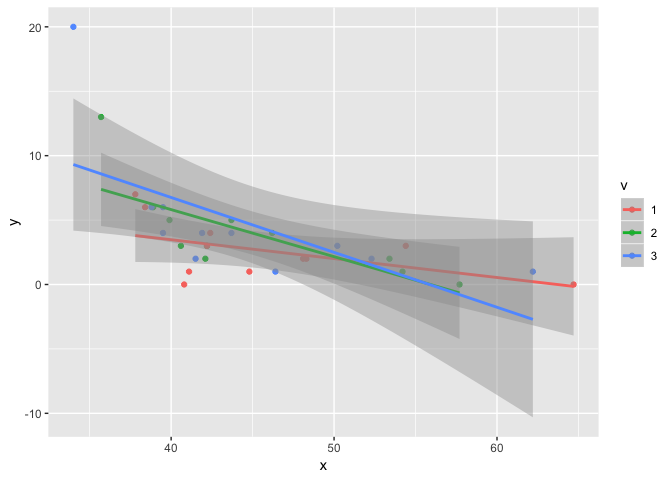
The following reprex might help to get you started, although I guess you'll need to work out how to get your specific data into the form used here.
library(tidyverse)

x1 <- c(64.7, 54.2, 46.4, 44.8, 42.2, 41.9, 42.2, 40.6, 39.5, 40.8, 42.1)
x2 <- c(62.2, 54.4, 53.4, 50.2, 48.1, 43.7, 41.5, 41.1, 38.9, 39.5, 38.4)
x3 <- c(57.7, 52.3, 48.3, 46.2, 43.7, 42.4, 39.9, 38.8, 37.8, 35.7, 34.0)
y1 <- c(0,1,1,1,3,4,3,3,6,0,2)
y2 <- c(1,3,2,3,2,5,2,1,6,4,6)
y3 <- c(0,2,2,4,4,4,5,6,7,13,20)

tbl <- tibble(x = c(x1, x2, x3), y = c(y1, y2, y3), v = factor(rep(1:3, length(x1))))

ggplot(tbl, aes(x = x, y = y, colour = v, group = v)) +
    geom_point() +
    geom_smooth(method='lm')
Created on 2019-05-24 by the reprex package (v0.2.1)
For future reference, a reprex is a nice way of providing example data and the code you have so far when you are asking a question. It helps people to be able to easily engage with the problem as they can cut and paste your data and code.
Ron.