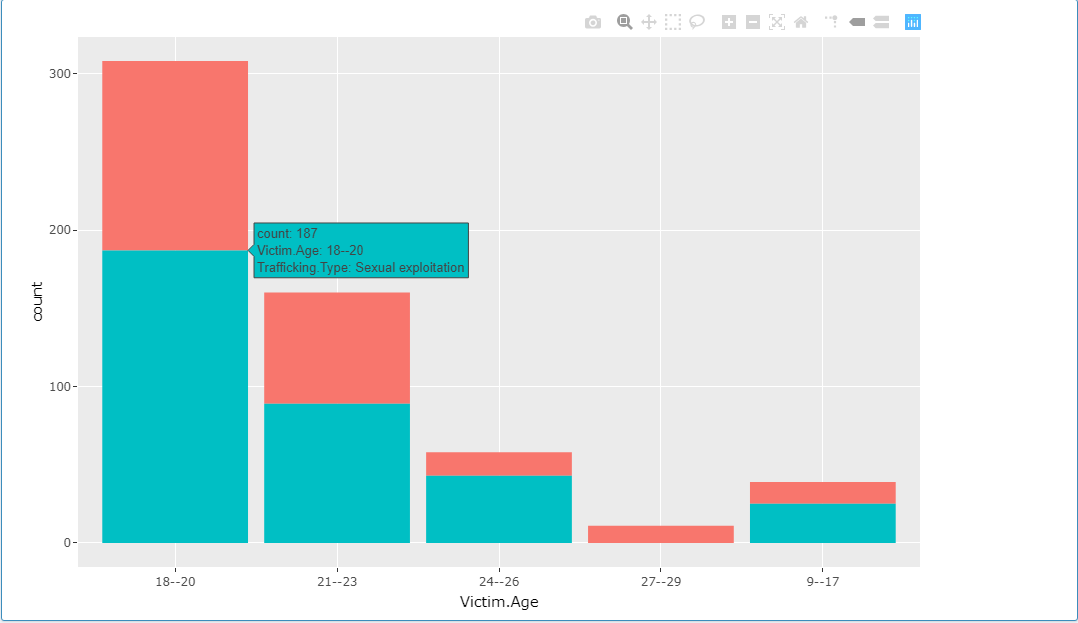
I have created a stacked graph and now want the highest result to be outputted into text. Currently I have gotten it to output from the selectInput and the radioButtons to out put "Female from US are more susceptible to " and now I want it to be able to read out the highest stack from the graph to add to the end of that sentence but not sure how to do it.
UI
In order for us to help you with your question, please provide us a minimal reprocudible example where you provide a minimal (dummy) dataset and code that can recreate the issue. One we have that, we can go from there. For help on creating a Reprex, see this guide:
It's not entirely clear to me what you're trying to do, but it seems like you want to get at the 'trained' ggplot2 data that gets fed into plotly, which you can do this way:
I'm not sure I explained myself very well, I have attached a photo of a part of the graph and in this case it should say females from RO are more susceptible to sexual exploitation between the ages of 18 - 20 and ignore the red above as is less than the 187 for the blue column. Essentially I am trying to link the largest part of the single column to text.