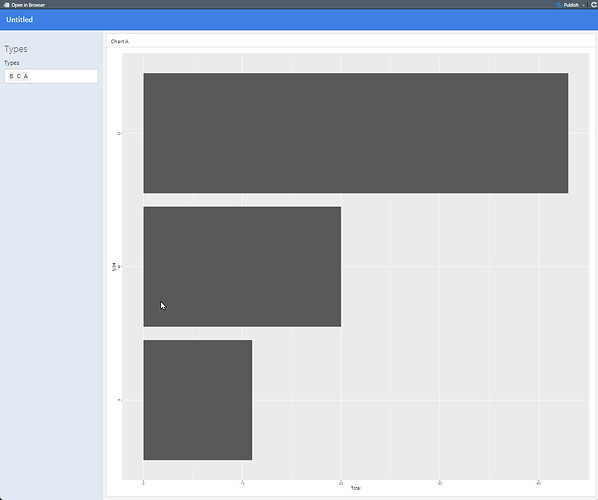
I have taken help from:
https://forum.posit.co/t/how-to-sum-two-variables-in-a-horizontal-bar-chart/161174
and changed the data a little with the intention of a different order of the types to make this Shiny Flexdashboard.
---
title: "Untitled"
output:
  flexdashboard::flex_dashboard:
    orientation: columns
    vertical_layout: fill
    runtime: shiny
---

```{r setup, include=FALSE}
library(flexdashboard)
library(tidyverse)
library(shiny)

type <- c("B", "C", "A", "B", "C", "C", "C", "B", "C", "C", "B", "A")
quant <- c(2, 9, 5, 11, 2, 9, 12, 2, 6, 5, 5, 6)

dat <- data.frame(type, quant)

dat1 <- dat |> group_by(type) |> summarize(Total = sum(quant))
Input{.sidebar}
Types
selectInput(inputId="types",label="Types",choices=dat$type, selected = dat$type,
             multiple = TRUE)
Column {data-width=650}
Chart A
renderPlot(
  ggplot(filter(dat1, type %in% input$types),aes(x = Total, y=type)) + geom_col()

)
It works as intended such as remove a type and the bar for that disappears. However, the choices in the input box are not in alphabetical order. How can I get them in alphabetical order?
