 prostate cancer datasets give me the willies, but I'll try to answer nonetheless:
# in answer to https://forum.posit.co/t/how-to-model-with-a-binary-response-when-i-want-to-find-best-threshold-for-a-predictor/20314/
if (!require(dplyr)) {
install.packages("dplyr")
library(dplyr)
}
#> Loading required package: dplyr
#>
#> Attaching package: 'dplyr'
#> The following objects are masked from 'package:stats':
#>
#> filter, lag
#> The following objects are masked from 'package:base':
#>
#> intersect, setdiff, setequal, union
if (!require(ggplot2)) {
install.packages("ggplot2")
library(ggplot2)
}
#> Loading required package: ggplot2
psad_sample <- tribble(
~cancer, ~pirads, ~psad,
1, "5", 1.25862068965517,
1, "5", 0.903921568627451,
1, "3", 0.0791208791208791,
0, "3", 0.171428571428571,
1, "4", 0.272222222222222,
0, "4", 0.133783783783784,
0, "4", 0.103333333333333,
0, "3", 0.1,
1, "5", 0.744444444444444,
0, "5", 0.0476190476190476,
1, "4", 0.221739130434783,
1, "5", 0.205555555555556,
0, "3", 0.0394736842105263,
1, "5", 2.30769230769231,
1, "5", 0.116279069767442,
0, "5", 2.49117647058824,
1, "4", 0.220833333333333,
0, "5", 0.157142857142857,
0, "5", 0.0788732394366197,
1, "5", 0.186486486486486
)
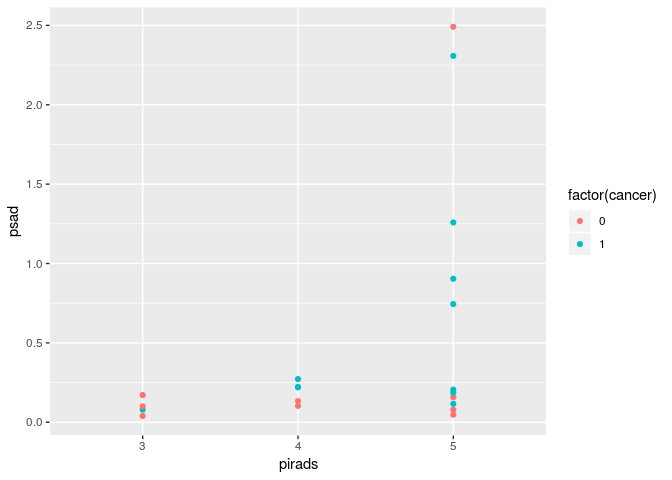
p <- ggplot(psad_sample, aes(x = pirads, y = psad, color = factor(cancer))) +
geom_point()
print(p)
psad_model <- glm(cancer ~ psad, family = binomial(), data = psad_sample)
pirads_model <- glm(cancer ~ pirads, family = binomial(), data = psad_sample)
print(summary(psad_model))
#>
#> Call:
#> glm(formula = cancer ~ psad, family = binomial(), data = psad_sample)
#>
#> Deviance Residuals:
#>     Min       1Q   Median       3Q      Max
#> -1.7019  -1.1870   0.8513   1.1432   1.1723
#>
#> Coefficients:
#>             Estimate Std. Error z value Pr(>|z|)
#> (Intercept) -0.02619    0.54989  -0.048    0.962
#> psad         0.48436    0.70888   0.683    0.494
#>
#> (Dispersion parameter for binomial family taken to be 1)
#>
#>     Null deviance: 27.526  on 19  degrees of freedom
#> Residual deviance: 27.010  on 18  degrees of freedom
#> AIC: 31.01
#>
#> Number of Fisher Scoring iterations: 4
print(summary(pirads_model))
#>
#> Call:
#> glm(formula = cancer ~ pirads, family = binomial(), data = psad_sample)
#>
#> Deviance Residuals:
#>     Min       1Q   Median       3Q      Max
#> -1.4224  -1.3537   0.9508   0.9508   1.6651
#>
#> Coefficients:
#>             Estimate Std. Error z value Pr(>|z|)
#> (Intercept)   -1.099      1.155  -0.951    0.341
#> pirads4        1.504      1.472   1.022    0.307
#> pirads5        1.658      1.314   1.262    0.207
#>
#> (Dispersion parameter for binomial family taken to be 1)
#>
#>     Null deviance: 27.526  on 19  degrees of freedom
#> Residual deviance: 25.649  on 17  degrees of freedom
#> AIC: 31.649
#>
#> Number of Fisher Scoring iterations: 4

glm_model <- glm(cancer ~ pirads + psad, family = binomial(), data = psad_sample)
glm_model_with_interactions <- glm(cancer ~ pirads * psad, family = binomial(), data = psad_sample)
#> Warning: glm.fit: fitted probabilities numerically 0 or 1 occurred
print(anova(psad_model, glm_model, glm_model_with_interactions, test ="Chisq"))
#> Analysis of Deviance Table
#>
#> Model 1: cancer ~ psad
#> Model 2: cancer ~ pirads + psad
#> Model 3: cancer ~ pirads * psad
#>   Resid. Df Resid. Dev Df Deviance Pr(>Chi)
#> 1        18     27.010
#> 2        16     25.543  2   1.4669  0.48026
#> 3        14     18.655  2   6.8883  0.03193 *
#> ---
#> Signif. codes:  0 '***' 0.001 '**' 0.01 '*' 0.05 '.' 0.1 ' ' 1
- Looking at your sample data set, data are not linearly separable. Good.
- fitting a
pirads-only model and a psad-only model, the residual deviance of the pirads-only model is actually lower than the deviance of the psad-only model. Even worse, they both are not significant. Uhhhh, not exactly comforting, given that (as far as I know, and I know very little about this stuff) testing for PSA is a widely used screening method, but I'm not a doctor and the dataset is very small, so hopefully this doesn't come as a surprise to you.
- We fit three nested models:
psad-only, psad & pirads (the usual multiple (generalized) linear model), and psad, pirads and interactions, and we run an asymptotic likelihood-ratio test (I'm sure there are more advanced exact tests for Binomial GLMs, but I don't know about them, or you could build your own exact test using permutations). The results are actually quite interesting: controlling for pirads too, once you control for psad, is useless (test is not significant), so it looks like once you take into account the information about psad, adding the information about pirads gives an improvement which is not distinguishable from what you would get by random chance. But, if you include interactions, the difference is significant (p-value = 0.03193). Note that this is an ANOVA test for nested models, so (at least asymptotically, when the distribution of the LR statistics approaches a \chi^2), it's accounting for multiple comparisons. However, with a more flexible model, your dataset now may becomes separable, or close to. As a matter of fact, the warning #> Warning: glm.fit: fitted probabilities numerically 0 or 1 occurred seems to indicate problems, and if you look at the standard errors they are actually huge, suggesting numerical and/or statistical issues with this model
> summary(glm_model_with_interactions)

Call:
glm(formula = cancer ~ pirads * psad, family = binomial(), data = psad_sample)

Deviance Residuals:
     Min        1Q    Median        3Q       Max
-1.55818  -0.78669   0.00006   0.94348   1.60254

Coefficients:
               Estimate Std. Error z value Pr(>|z|)
(Intercept)  -7.787e-03  2.633e+00  -0.003    0.998
pirads4      -7.441e+01  1.537e+04  -0.005    0.996
pirads5       4.364e-01  2.763e+00   0.158    0.875
psad         -1.203e+01  2.797e+01  -0.430    0.667
pirads4:psad  4.324e+02  8.135e+04   0.005    0.996
pirads5:psad  1.221e+01  2.798e+01   0.436    0.663

(Dispersion parameter for binomial family taken to be 1)

    Null deviance: 27.526  on 19  degrees of freedom
Residual deviance: 18.655  on 14  degrees of freedom
AIC: 30.655

Number of Fisher Scoring iterations: 18
Thus, the logistic regression fit may not be reliable anymore. In other words, don't draw any conclusions based on this elementary analysis, but repeat it on your full dataset. If you still get these numerical issues, then I suggest you post a new question here or on Cross Validated on how to deal with fitting issues for the logistic regression model. Or, you could change model/add regularization to bypass the issue.
Conclusions and future work
- My naive impression is that
psad & pirads contain somewhat the same information about cancer, so once one of either variables is in the model, adding the other one doesn't increase the predictive accuracy of the model by much
- Including interactions seems to change this fact, but before drawing any solid conclusions you need to run the model with interactions and verify if it achieved perfect separation or not. I don't think so, because the residual deviance is still relatively large, but you may want to check.
- Of course, all this is very tentative and nothing can be really said until you rerun the analysis on the full data set
- Finally, if (big IF!) the results from this initial analysis are confirmed by an analysis on the full dataset, the residual deviance is still very large, i.e., even the model with interactions does a crappy job of predicting
cancer. You may want to try some different models (e.g., SVMs or XGBoost), but if you do so, be sure to use cross-validation to avoid being fooled by overfitting. How large is your full data set?
Let me know if this helped, and how the results change on the complete dataset.

 Given the date and the (not-so-surprising) fact that I'll have to read up on some of this it might be a few days before I'm able to reply properly, but...I'll be back.